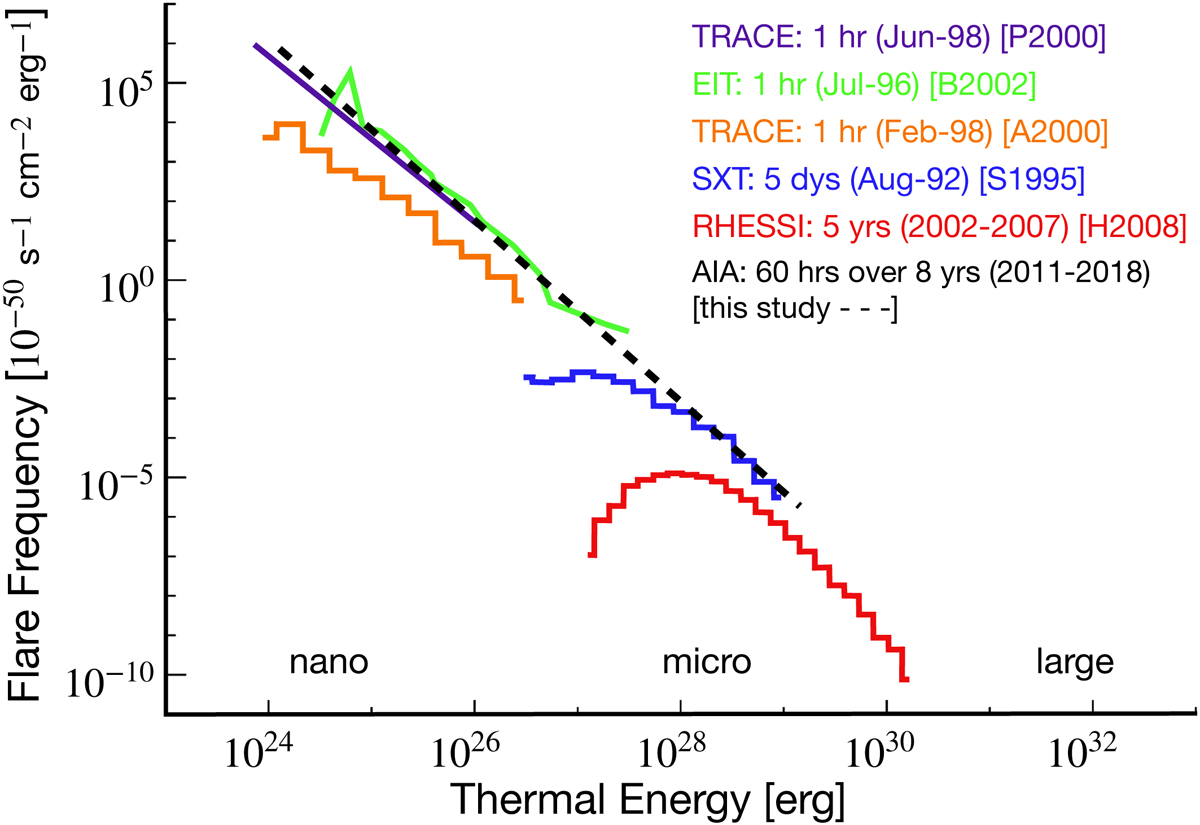
Fig. 11.
Download original image
Comparison of solar flare energy distributions derived by different studies. Shown are EUV nanoflares observed with either SOHO/EIT by Benz & Krucker (2002) or TRACE by Parnell & Jupp (2000) and Aschwanden et al. (2000). Microflares were observed with Yohkoh/SXT by Shimizu (1995) and with RHESSI by Hannah et al. (2008). The combined AIA nanoflare observations from this study is also included and indicated by the black dashed line. The figure was adapted from Hannah et al. (2011).
Current usage metrics show cumulative count of Article Views (full-text article views including HTML views, PDF and ePub downloads, according to the available data) and Abstracts Views on Vision4Press platform.
Data correspond to usage on the plateform after 2015. The current usage metrics is available 48-96 hours after online publication and is updated daily on week days.
Initial download of the metrics may take a while.