Free Access
Fig. 10.
Download original image
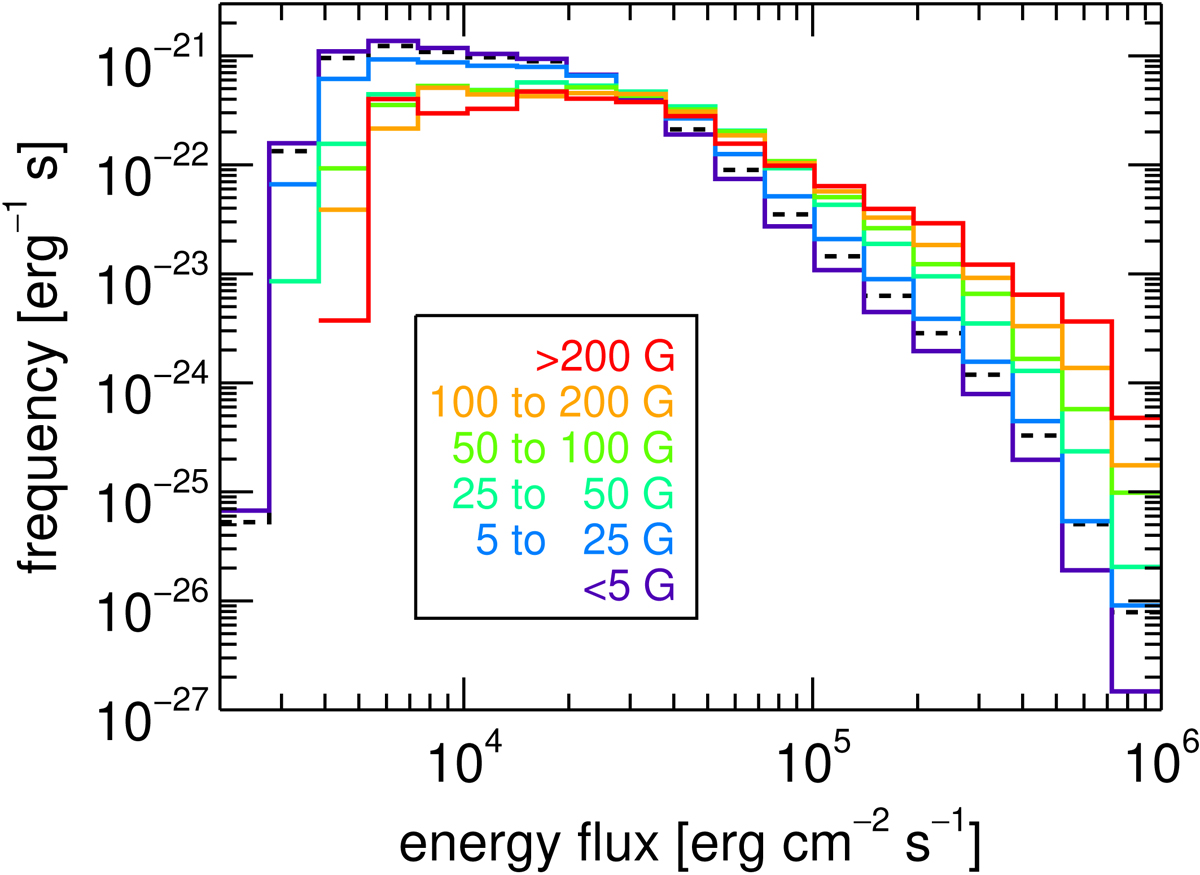
Frequency distributions of energy flux in areas defined by different absolute magnetic flux density intervals. The whole energy flux distribution independent of the underlying magnetic flux density is shown as a dashed black line.
Current usage metrics show cumulative count of Article Views (full-text article views including HTML views, PDF and ePub downloads, according to the available data) and Abstracts Views on Vision4Press platform.
Data correspond to usage on the plateform after 2015. The current usage metrics is available 48-96 hours after online publication and is updated daily on week days.
Initial download of the metrics may take a while.