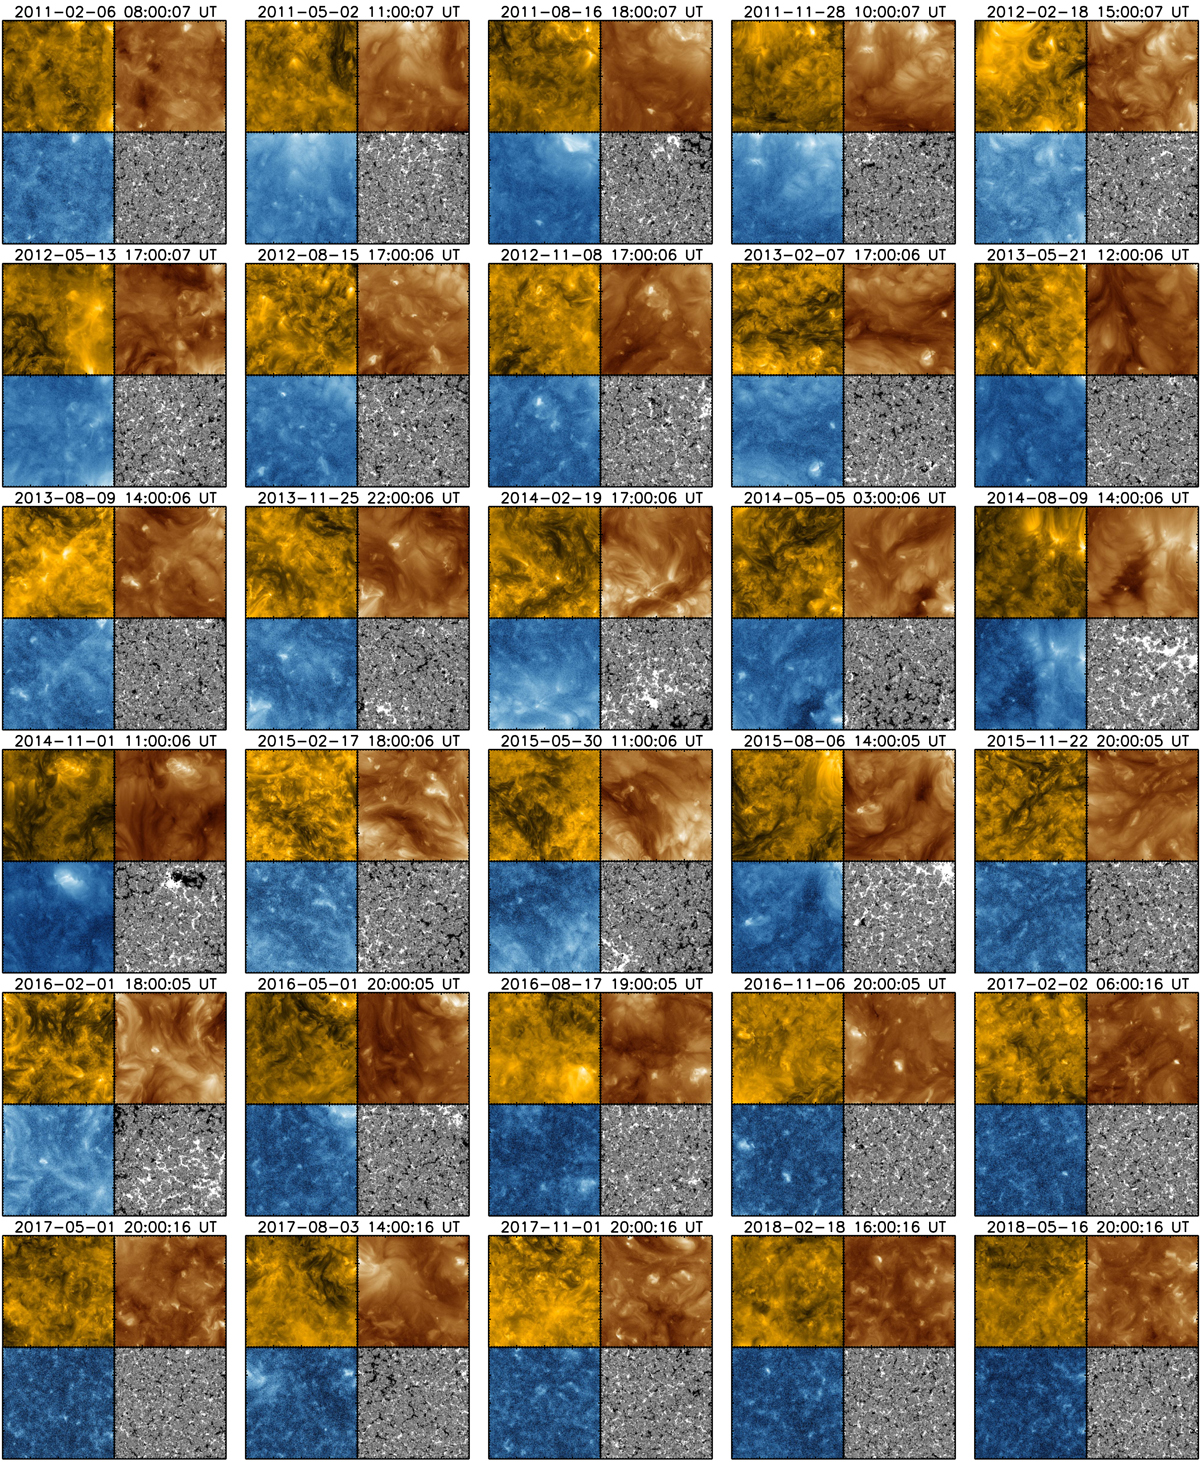
Fig. 1.
Download original image
Groups of the first AIA 171 Å, 193 Å, and 335 Å images for each of the 30 data sets plus the HMI line-of-sight magnetogram (saturated at ±15 G.) from the beginning of each observation series. All images focus on a 400″ × 400″ FOV around the center of the solar disk. The start of the observation time is displayed above each image group, and the complete data sets consist of all images taken during the two hours following the shown images.
Current usage metrics show cumulative count of Article Views (full-text article views including HTML views, PDF and ePub downloads, according to the available data) and Abstracts Views on Vision4Press platform.
Data correspond to usage on the plateform after 2015. The current usage metrics is available 48-96 hours after online publication and is updated daily on week days.
Initial download of the metrics may take a while.