Free Access
Fig. A.1.
Download original image
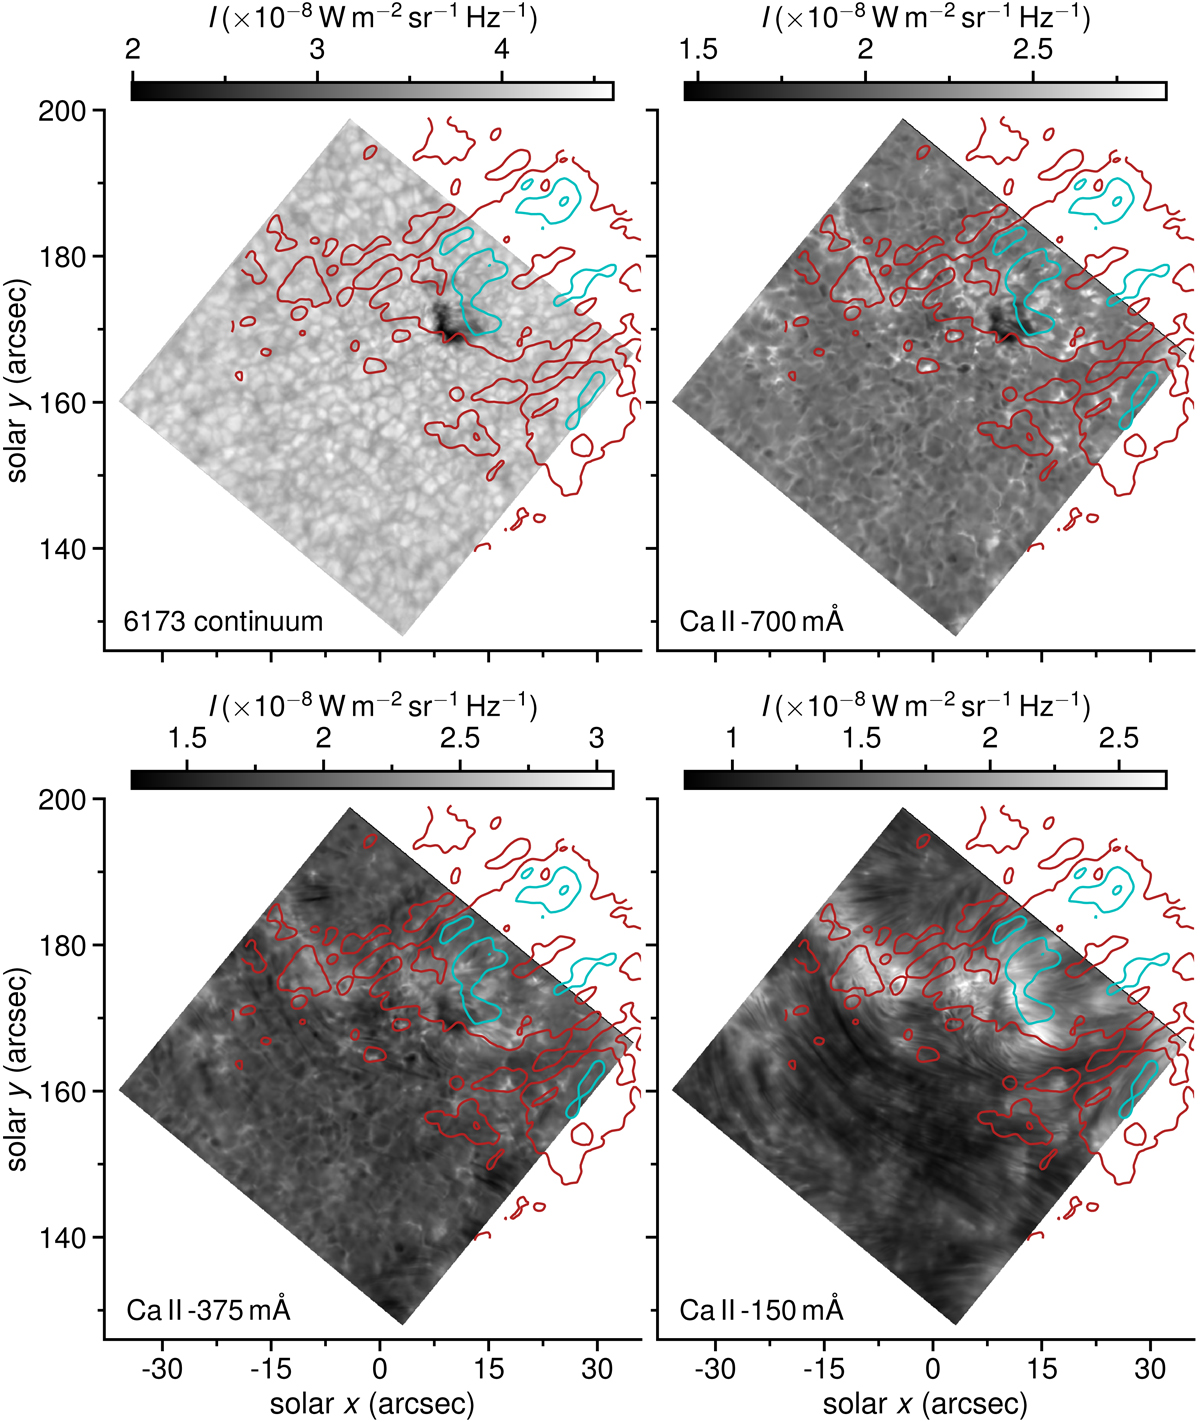
SST/CRISP photospheric and chromospheric filtergrams. Intensity in the continuum at 6173 Å and at different wavelengths in the blue wing of λ8542. The red and cyan contours correspond to Tb[3 mm] = 8 and 9 kK mapped by ALMA.
Current usage metrics show cumulative count of Article Views (full-text article views including HTML views, PDF and ePub downloads, according to the available data) and Abstracts Views on Vision4Press platform.
Data correspond to usage on the plateform after 2015. The current usage metrics is available 48-96 hours after online publication and is updated daily on week days.
Initial download of the metrics may take a while.