Fig. 7.
Download original image
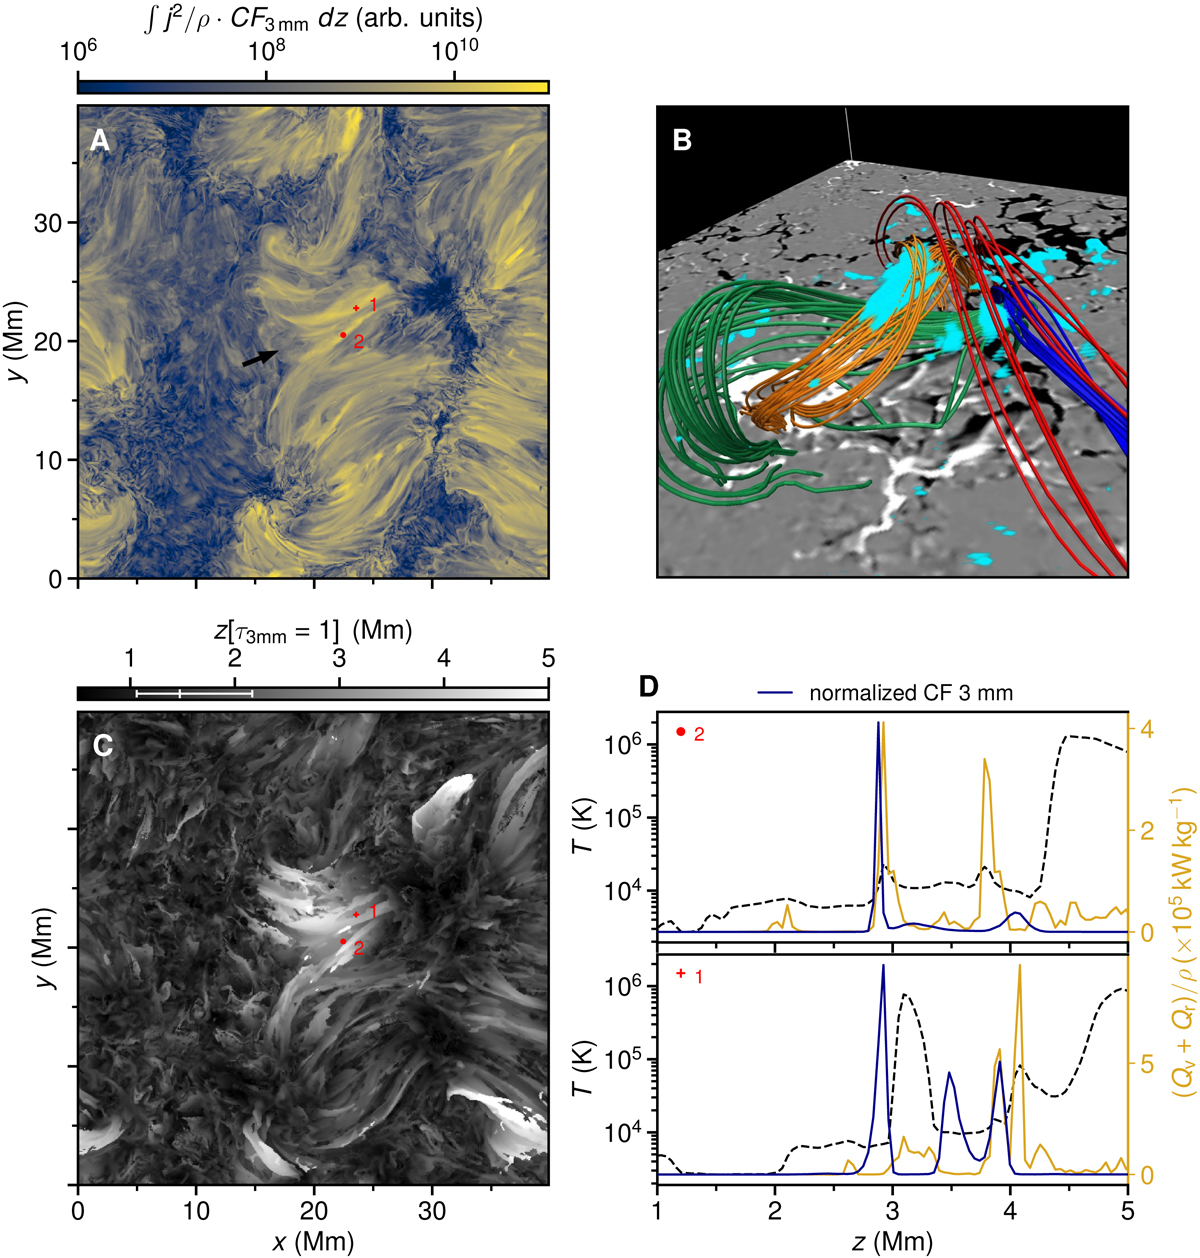
Heating rates and the formation of the millimeter continuum in the simulation. Panel A: integrated j2/ρ weighted by the contribution function of the 3 mm continuum (CF3 mm). Panel B: photospheric magnetogram (range ±1 kG) with three-dimensional rendering of magnetic field lines and CF3 mm (blue shade) of the region indicated by the arrow in panel A. A threshold was applied to the CF values not to hide the field lines. Panel C: height at which τ = 1 at 3 mm; the errorbar overlaid on the colormap shows the median and the range between the 16th and 84th percentiles of the distribution. Panel D: temperature (dashed lines), total heating rates per mass (yellow lines), and CF3 mm (blue lines) as a function of height at two locations indicated in panels A and C.
Current usage metrics show cumulative count of Article Views (full-text article views including HTML views, PDF and ePub downloads, according to the available data) and Abstracts Views on Vision4Press platform.
Data correspond to usage on the plateform after 2015. The current usage metrics is available 48-96 hours after online publication and is updated daily on week days.
Initial download of the metrics may take a while.