Fig. 5.
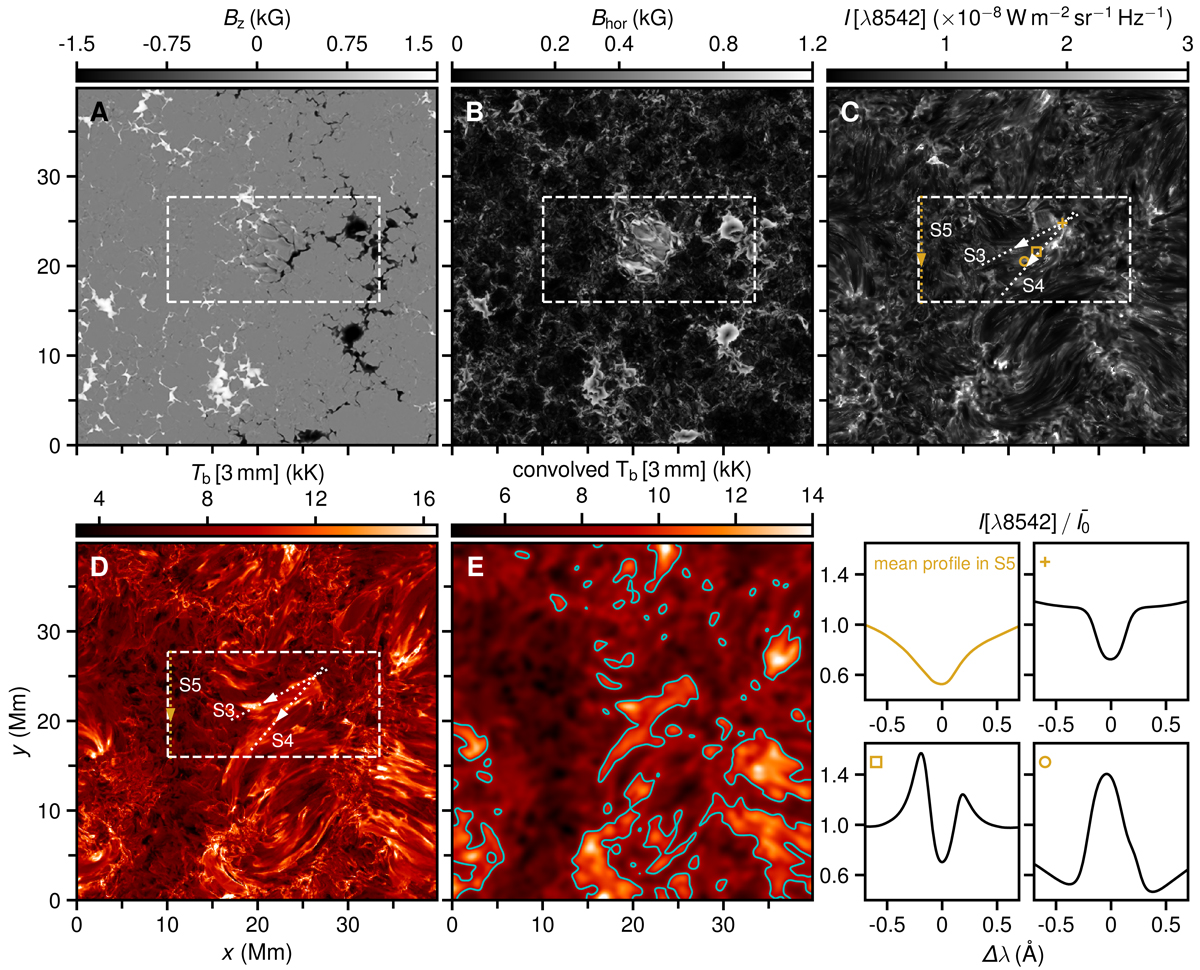
Download original image
Simulated magnetograms and synthetic emission. Strength of the vertical (panel A) and horizontal (panel B) components of the magnetic field at z = 0 Mm; panel B has been gamma-adjusted for display purposes. Panel C: intensity in the core of λ8542; the range is capped for display purposes. Panels D and E: Continuum Tb [3 mm] at full resolution and convolved with a Gaussian kernel with full-width-at-half-maximum of 1.2″; the cyan contours show Tb [3 mm] = 9 kK. The dashed box delimits the area displayed in Figs. 6B and C. The lower right panels show selected λ8542 profiles (normalized intensity) in the flux emergence region. Vertical cuts through various parameters of the simulated atmosphere along the slices S3, S4, and S5 are displayed in Fig. A.6.
Current usage metrics show cumulative count of Article Views (full-text article views including HTML views, PDF and ePub downloads, according to the available data) and Abstracts Views on Vision4Press platform.
Data correspond to usage on the plateform after 2015. The current usage metrics is available 48-96 hours after online publication and is updated daily on week days.
Initial download of the metrics may take a while.