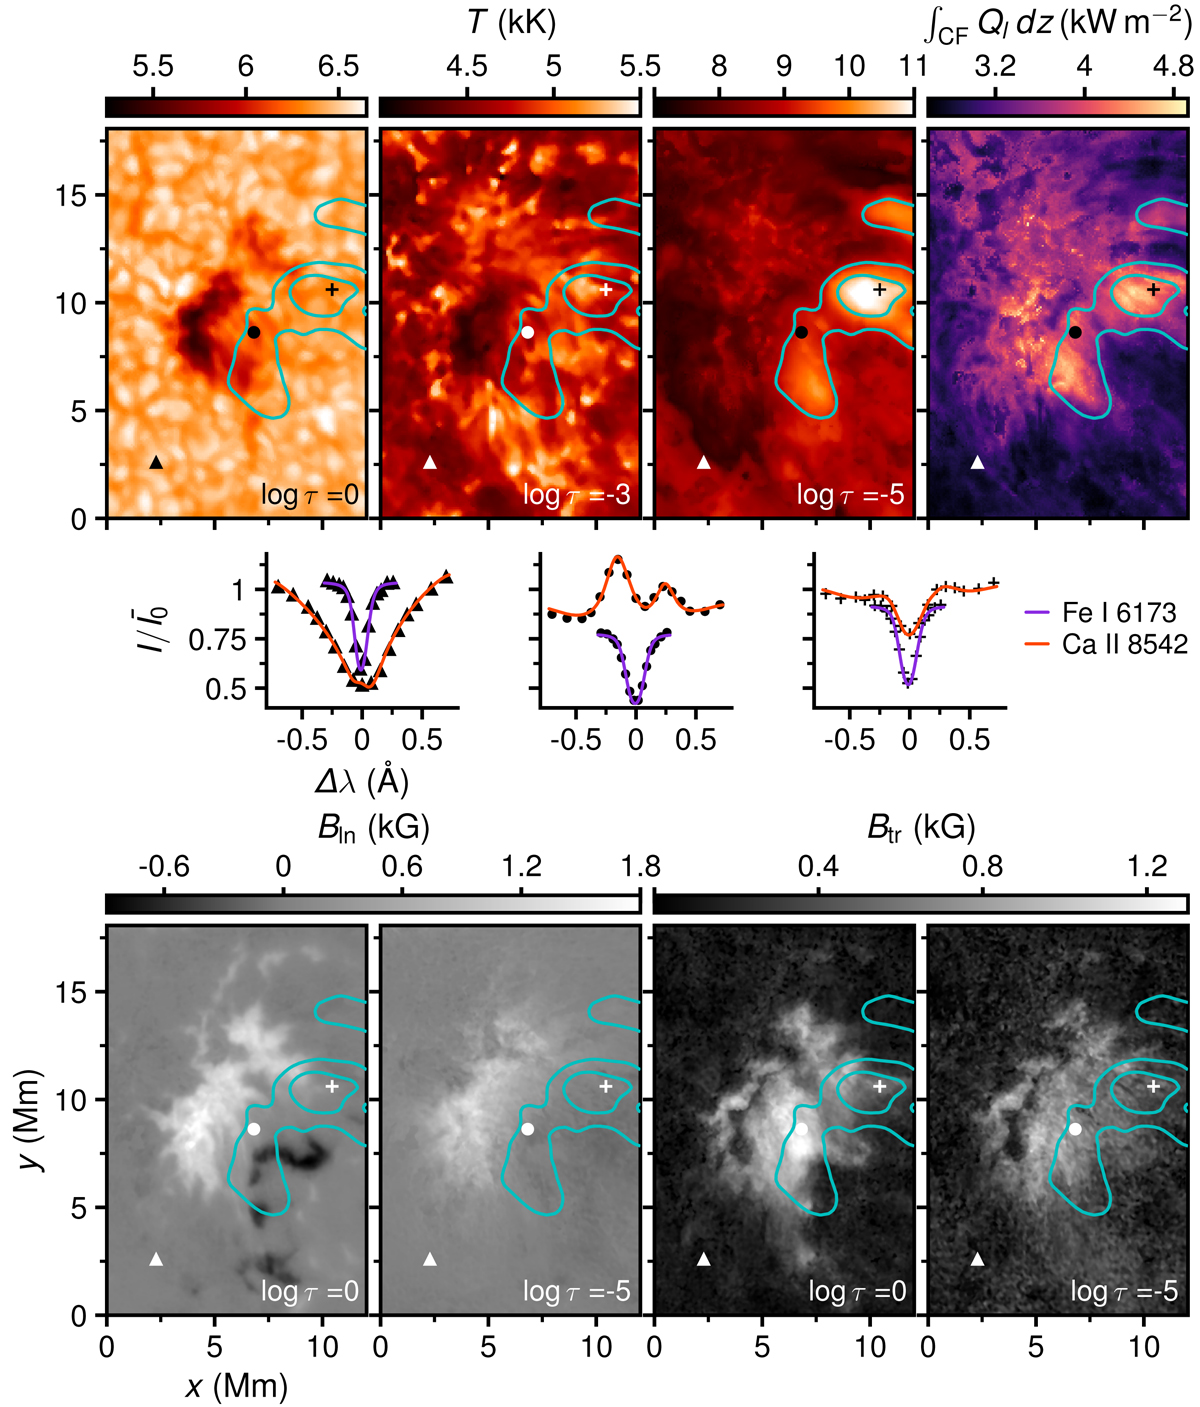
Fig. 3.
Download original image
Non-LTE inversions of the spectral data and radiative losses in the upper chromosphere. Temperature, integrated radiative losses within the contribution function of the 3 mm continuum, longitudinal field strength, and transverse field strength at selected optical depths from the photosphere to the chromosphere are shown. The cyan contours correspond to Tb [3 mm] = 9 and 10 kK. The middle row shows example observed (markers) and fitted (solid lines) intensity of the λ6173 and λ8542 lines at three locations indicated by different markers overlaid on the other panels; the intensity is normalized by ![]() – the mean intensity at the bluest sampled wavelength of each line.
– the mean intensity at the bluest sampled wavelength of each line.
Current usage metrics show cumulative count of Article Views (full-text article views including HTML views, PDF and ePub downloads, according to the available data) and Abstracts Views on Vision4Press platform.
Data correspond to usage on the plateform after 2015. The current usage metrics is available 48-96 hours after online publication and is updated daily on week days.
Initial download of the metrics may take a while.