Fig. 2.
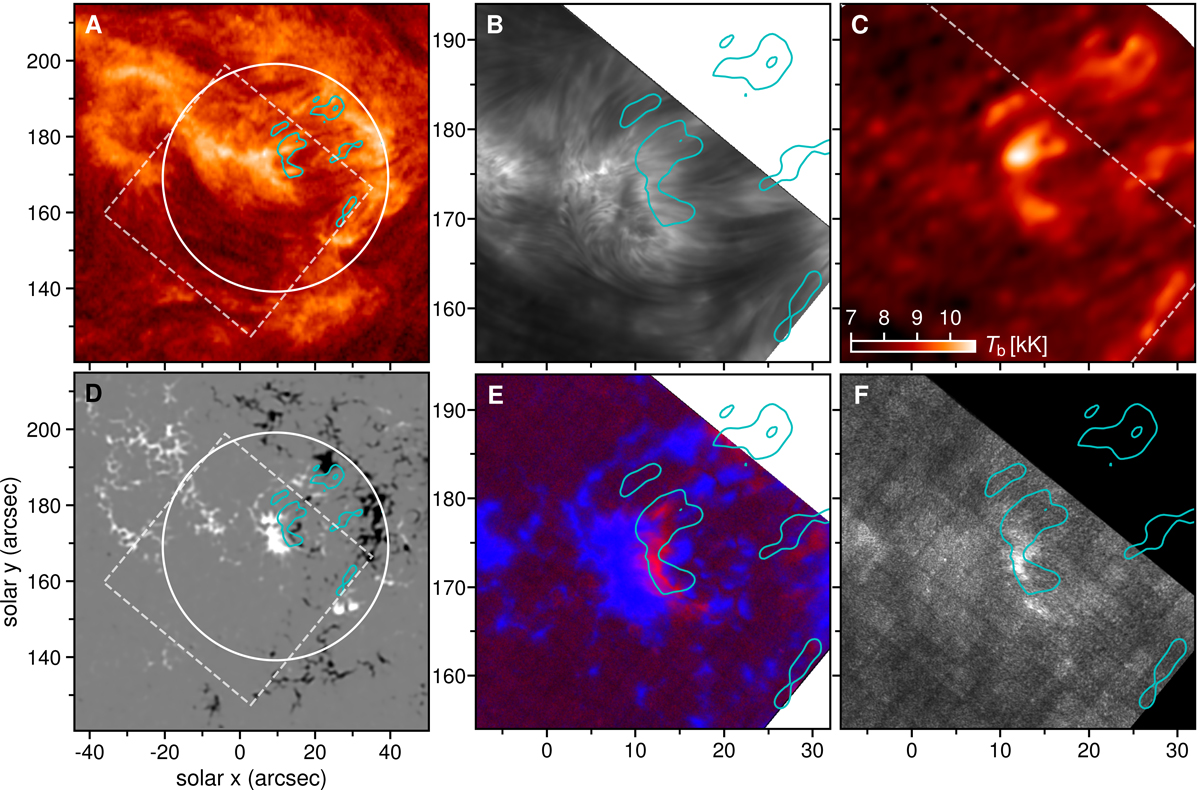
Download original image
Multiwavelength imaging of a solar active region. The leftmost panels show an extended view of the target, while the ones on the right show a closer look at the center. Panel A: AIA 304 Å intensity in logarithmic scale (18:48:53 UTC); panel B: SST/CRISP λ8542 Å core (18:48:41 UTC); panel C: ALMA brightness temperature at 3 mm (18:48:53 UTC); panel D: HMI LOS magnetogram clipped at ±1 kG (white/black, 18:49:30 UTC); panel E: composite of total linear polarization (red) and total circular polarization (blue) in λ6173 (18:48:53 UTC); panel F: TLP in λ8542 (18:48:41 UTC). Solid circle and dashed square show the ALMA and SST fields. The cyan contours correspond to Tb [3 mm] = 9 kK.
Current usage metrics show cumulative count of Article Views (full-text article views including HTML views, PDF and ePub downloads, according to the available data) and Abstracts Views on Vision4Press platform.
Data correspond to usage on the plateform after 2015. The current usage metrics is available 48-96 hours after online publication and is updated daily on week days.
Initial download of the metrics may take a while.