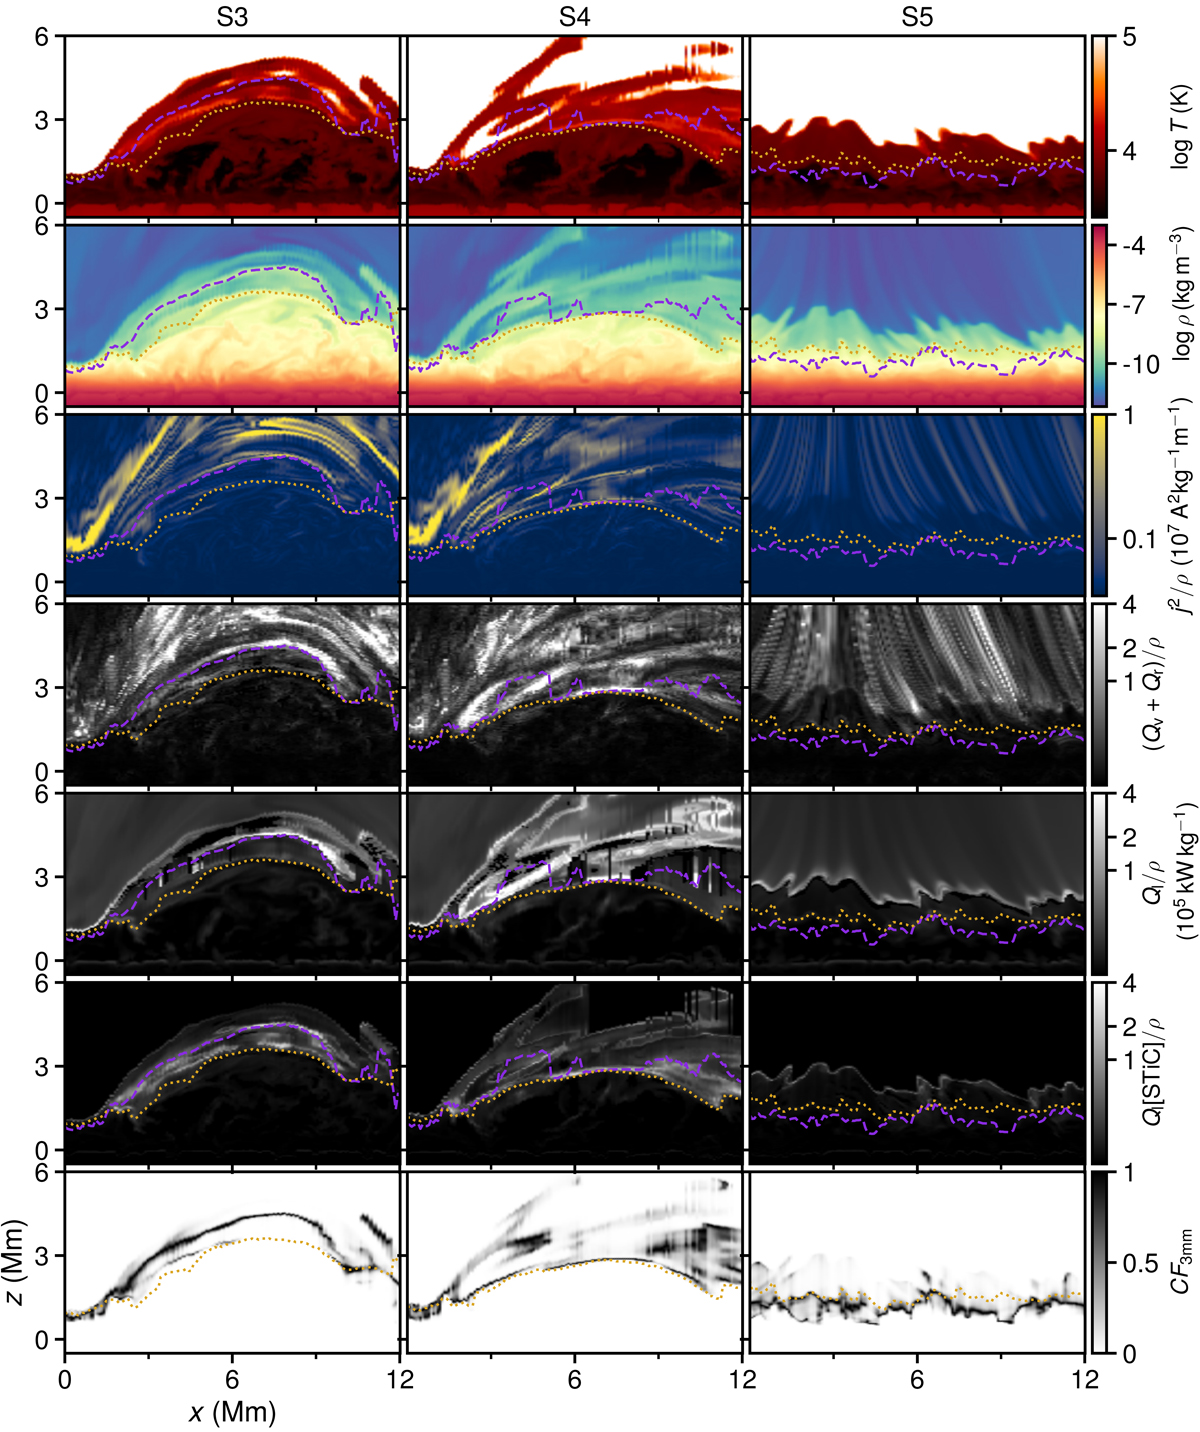
Fig. A.6.
Download original image
2D view of the simulation. Vertical cuts through the atmosphere along the slices S3, S4, and S5 (see Fig. 5). The dashed line shows the τ = 1 layer of the 3 mm continuum, the dotted line the same quantity for the core of λ8542. With the exception of the two top rows and the bottom row, all panels are displayed in power-law scale for display purposes.
Current usage metrics show cumulative count of Article Views (full-text article views including HTML views, PDF and ePub downloads, according to the available data) and Abstracts Views on Vision4Press platform.
Data correspond to usage on the plateform after 2015. The current usage metrics is available 48-96 hours after online publication and is updated daily on week days.
Initial download of the metrics may take a while.