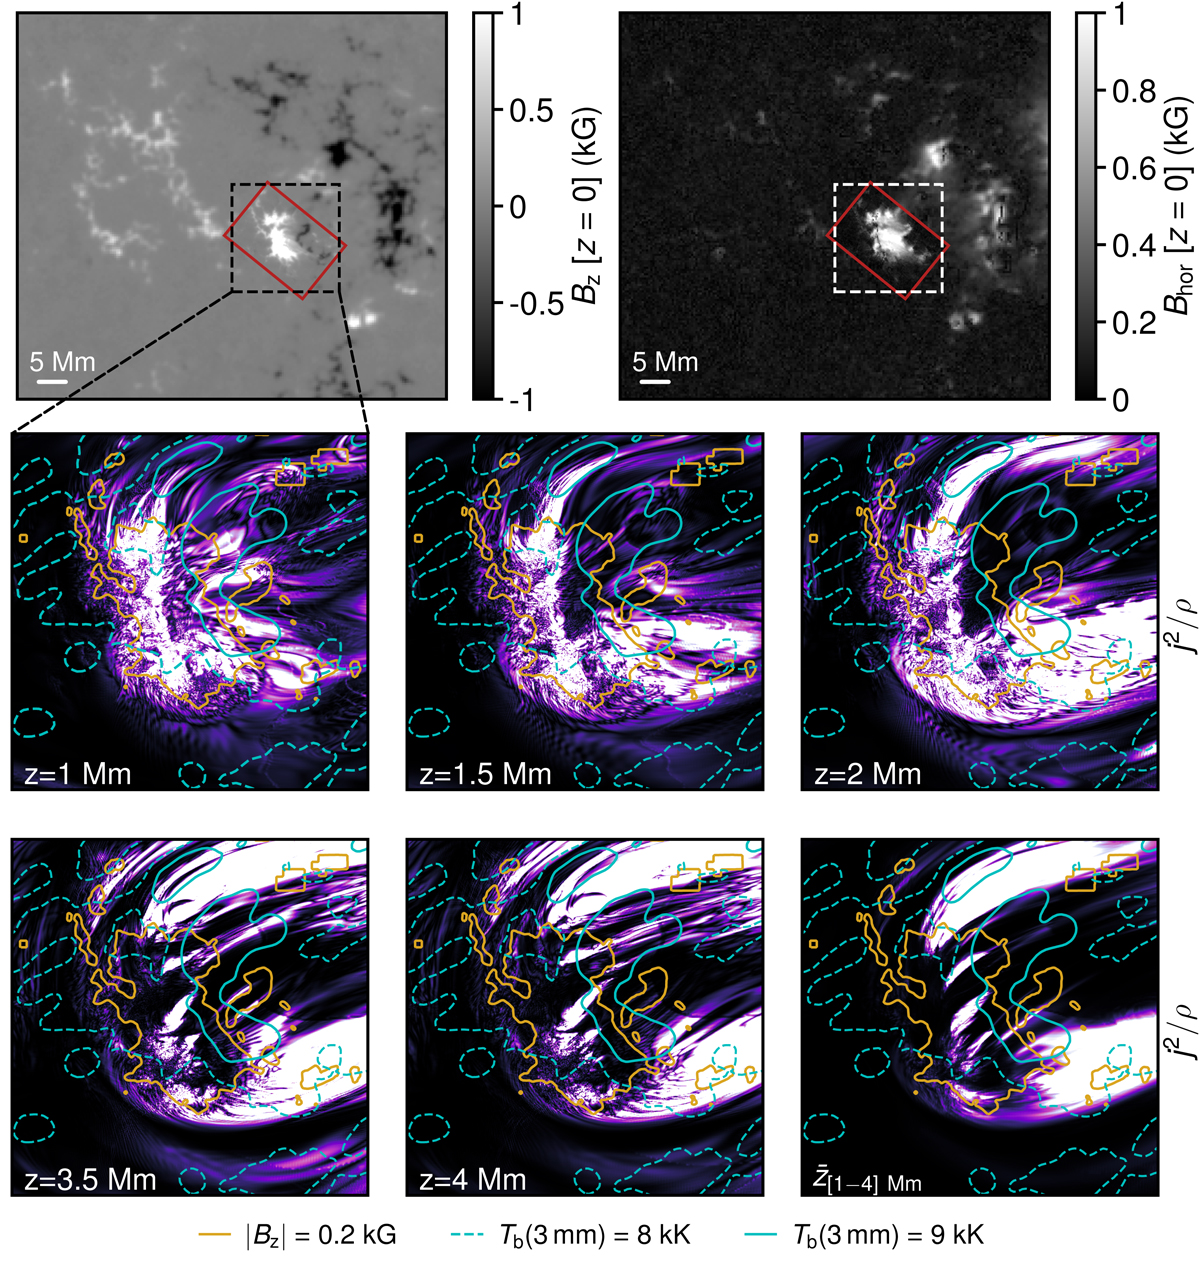
Fig. A.4.
Download original image
Current density calculated from the magnetic field extrapolation. The red rectangle in the top panels delimits the embedded SST/CRISP FOV in the extended HMI magnetogram. The middle and lower rows show j2/ρ at different heights in square-root scaling and arbitrary units for qualitative comparison with ALMA Tb contour overlays (cyan lines) within the region delimited by the dashed box. The lower right panel shows j2/ρ averaged over height between z = [1, 4] Mm. The yellow contour indicates |Bz| at z = 0 Mm.
Current usage metrics show cumulative count of Article Views (full-text article views including HTML views, PDF and ePub downloads, according to the available data) and Abstracts Views on Vision4Press platform.
Data correspond to usage on the plateform after 2015. The current usage metrics is available 48-96 hours after online publication and is updated daily on week days.
Initial download of the metrics may take a while.