Fig. A.3.
Download original image
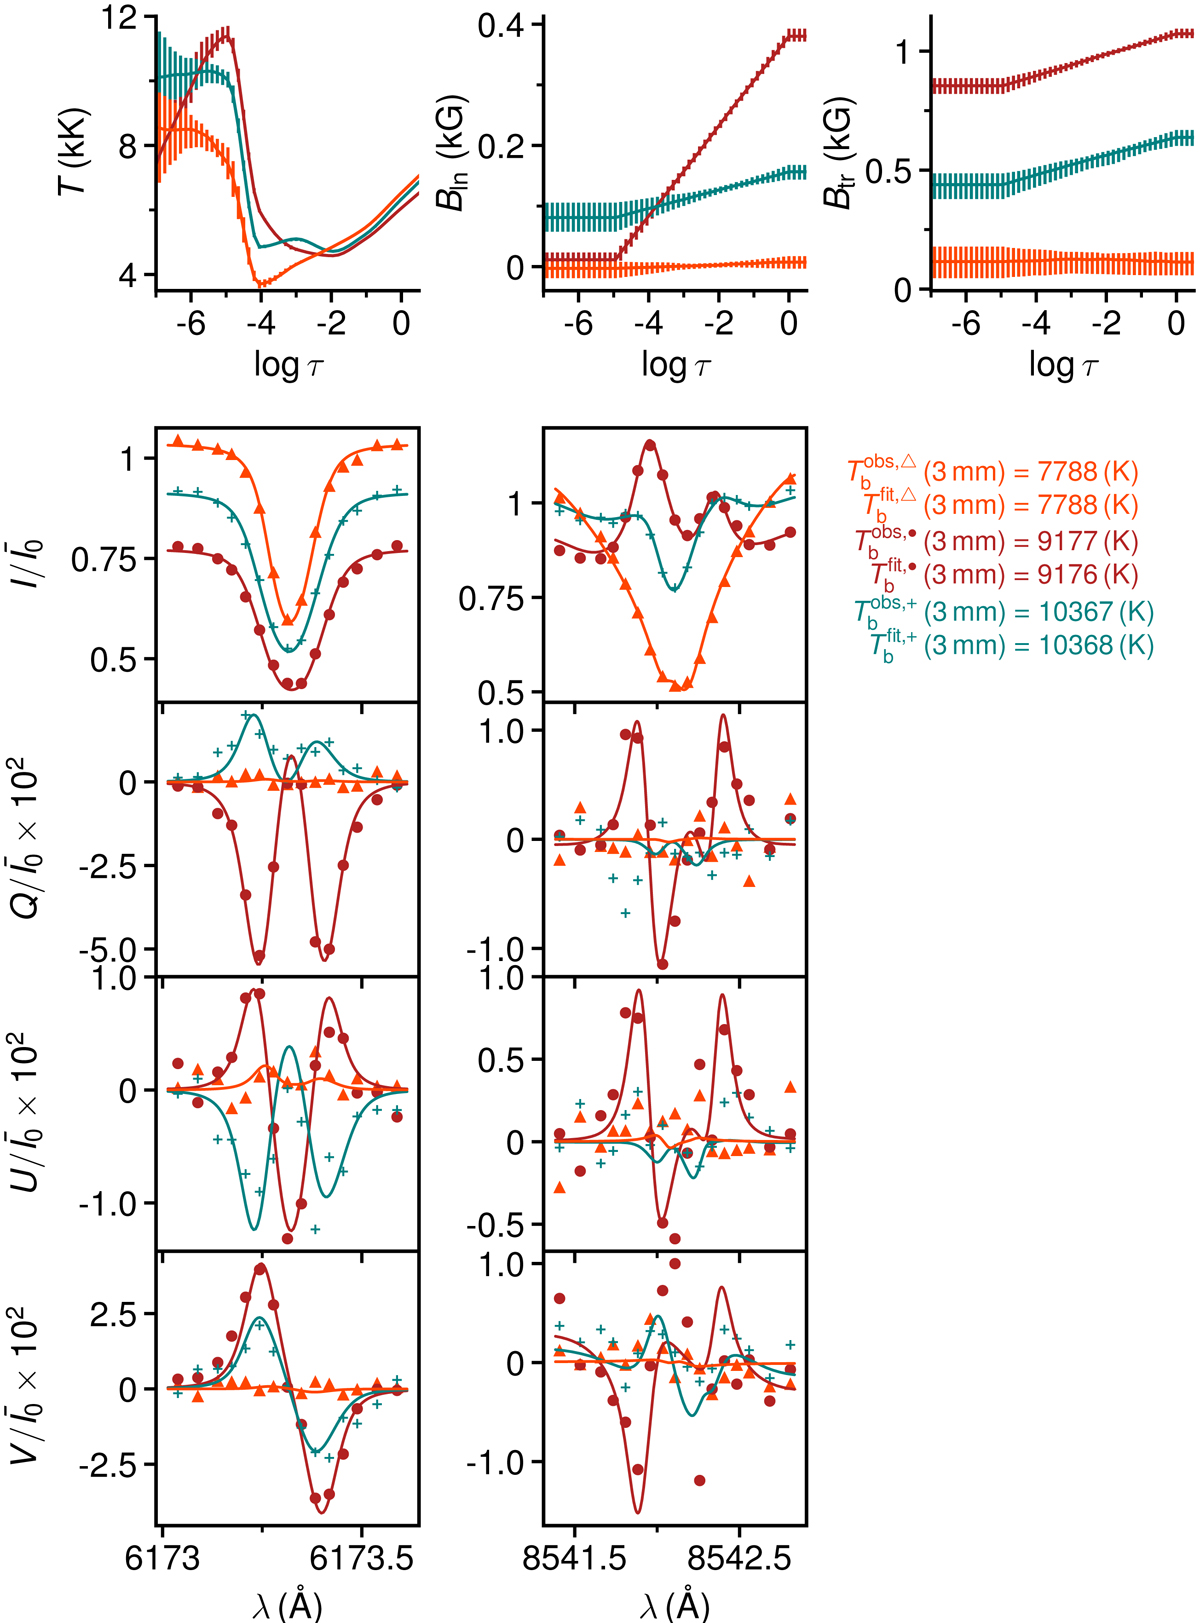
Observed and best-fit Stokes profiles and corresponding non-LTE models. The three example profiles (normalized by ![]() – the mean intensity in the “quiet” part of the FOV at the bluest wavelength) correspond to the markers shown in Fig. 3. Observed and synthetic Tb [3 mm] values are indicated on the right. The solid lines and vertical bars in the top panels show the median and the range between the 16th and 84th percentiles of the Monte-Carlo distributions at each optical depth grid point.
– the mean intensity in the “quiet” part of the FOV at the bluest wavelength) correspond to the markers shown in Fig. 3. Observed and synthetic Tb [3 mm] values are indicated on the right. The solid lines and vertical bars in the top panels show the median and the range between the 16th and 84th percentiles of the Monte-Carlo distributions at each optical depth grid point.
Current usage metrics show cumulative count of Article Views (full-text article views including HTML views, PDF and ePub downloads, according to the available data) and Abstracts Views on Vision4Press platform.
Data correspond to usage on the plateform after 2015. The current usage metrics is available 48-96 hours after online publication and is updated daily on week days.
Initial download of the metrics may take a while.