Free Access
Fig. 3.
Download original image
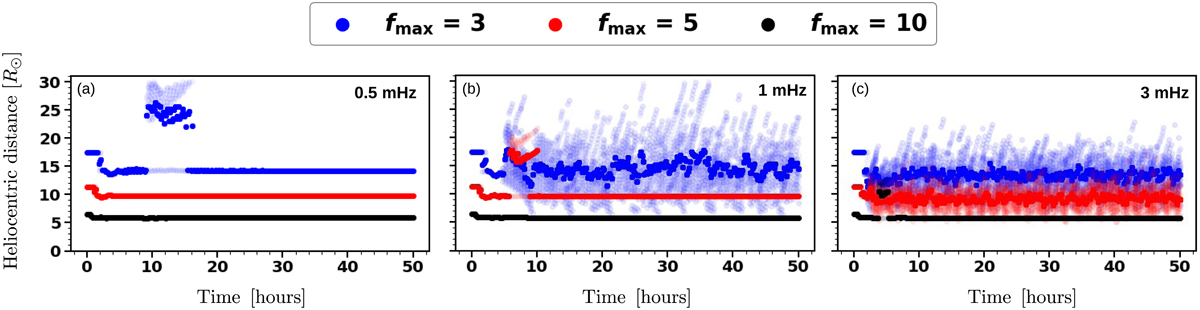
Evolution of Alfvén crossings (vr > vA) with time for the solar-wind conditions in Fig. 2. The opaque markings denote the mean location of these crossings at a given heliocentric distance, while the transparent markings denote the instantaneous locations of the Alfvén crossings.
Current usage metrics show cumulative count of Article Views (full-text article views including HTML views, PDF and ePub downloads, according to the available data) and Abstracts Views on Vision4Press platform.
Data correspond to usage on the plateform after 2015. The current usage metrics is available 48-96 hours after online publication and is updated daily on week days.
Initial download of the metrics may take a while.