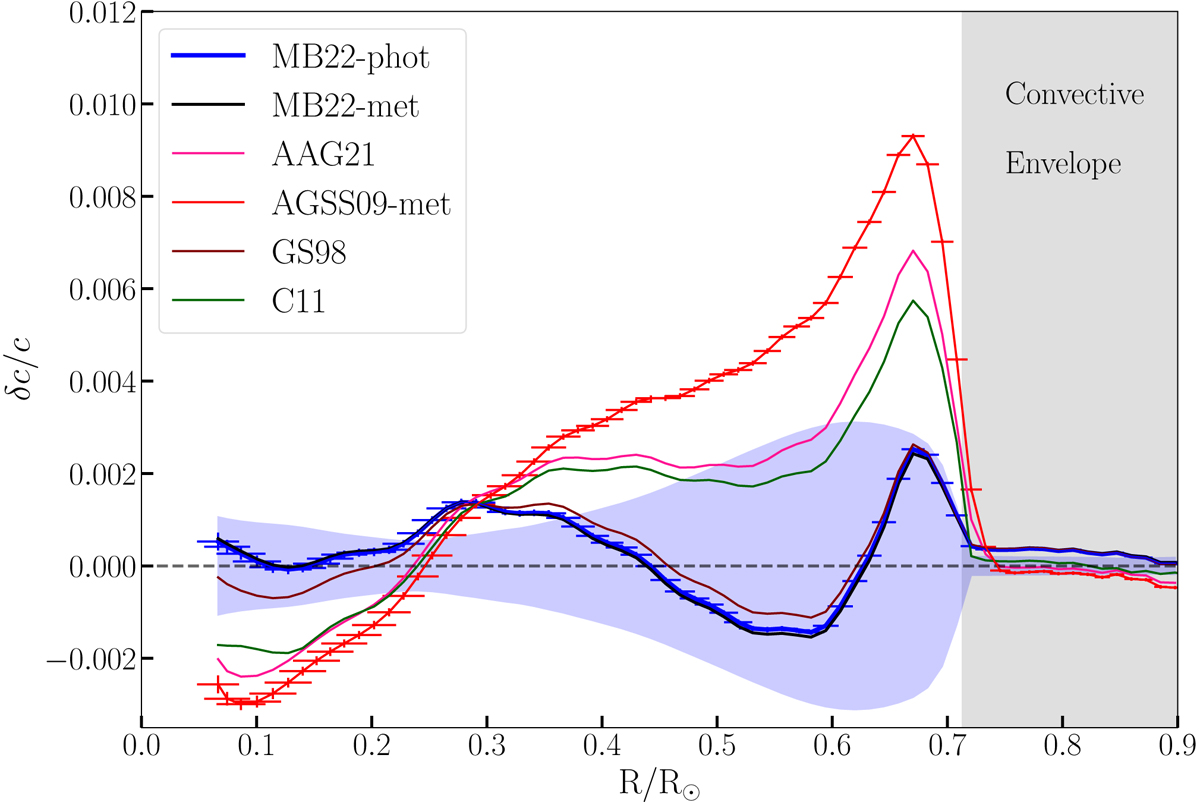
Fig. 6.
Download original image
Sound speed profiles of the SSM computed using different solar chemical mixtures, Caffau et al. (2011, C11), Asplund et al. (2009, AGSS09-met), Grevesse & Sauval (1998, GS98), Asplund et al. (2021, AAG21), and this work (MB22-phot and MB22-met, see Sect. 3.3 for details). The shaded blue area represents the solar model uncertainties arising from the inputs to the model, see Villante et al. (2014) for details. Error bars in AGSS09-met and MB22-phot lines denote fractional sound speed uncertainties arising from helioseismic data (y-axis) and the widths of inversion kernels (x-axis).
Current usage metrics show cumulative count of Article Views (full-text article views including HTML views, PDF and ePub downloads, according to the available data) and Abstracts Views on Vision4Press platform.
Data correspond to usage on the plateform after 2015. The current usage metrics is available 48-96 hours after online publication and is updated daily on week days.
Initial download of the metrics may take a while.