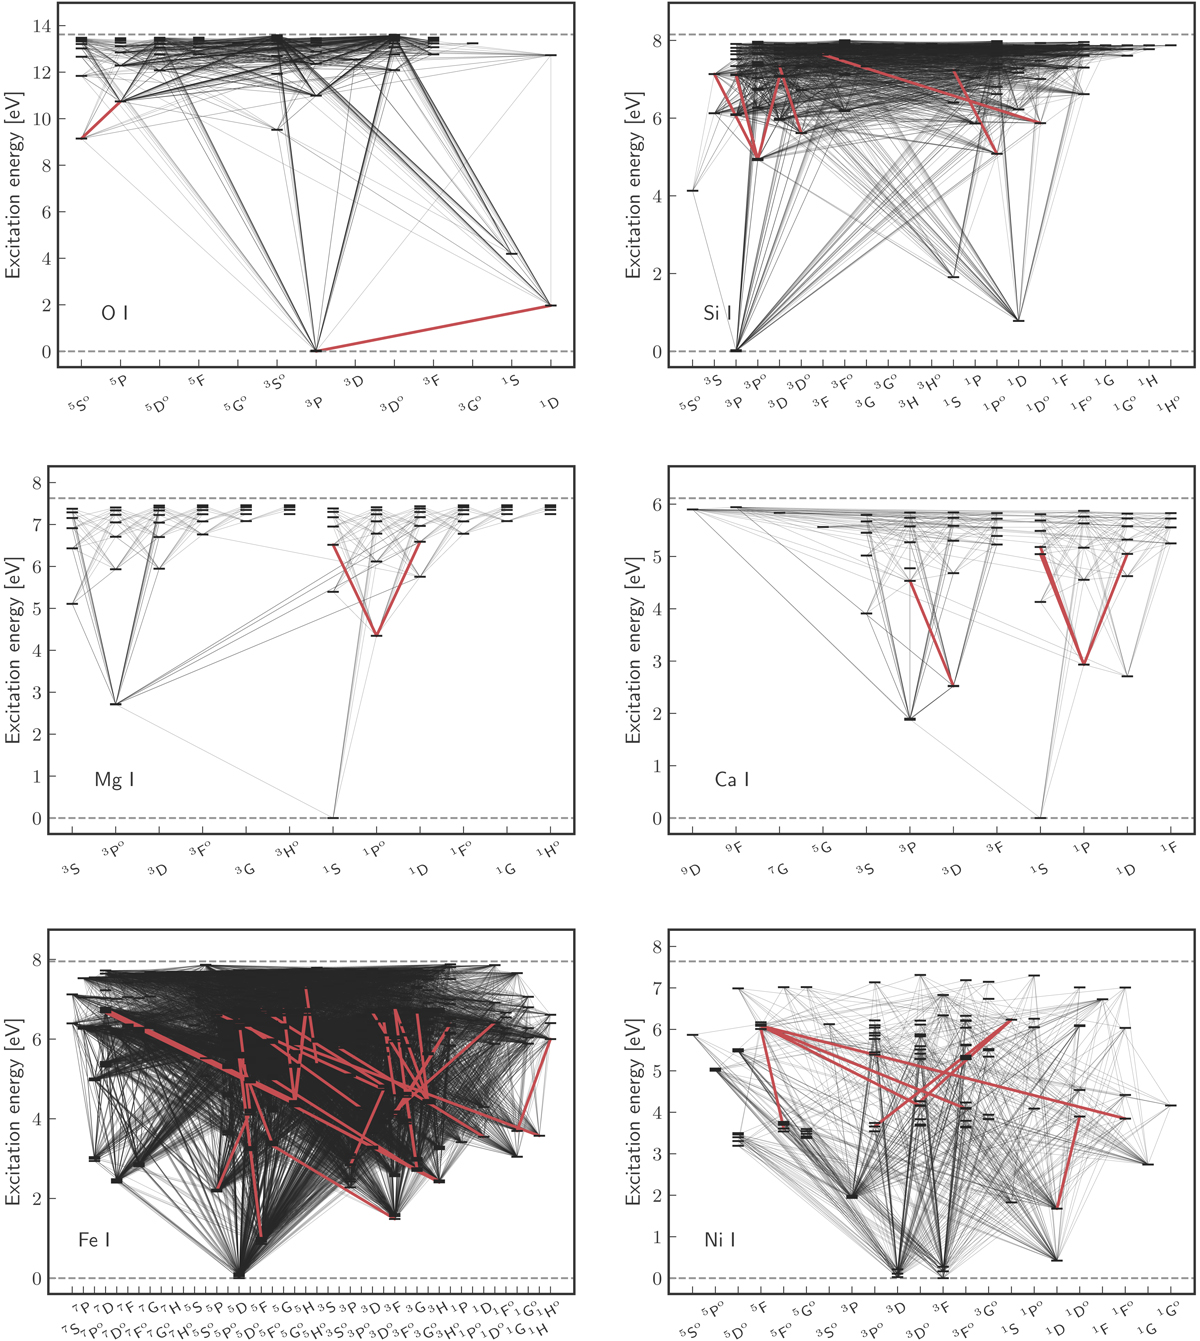
Fig. 3.
Download original image
Grotrian diagrams for chemical elements treated in NLTE. Energy states are depicted with horizontal dashes and connecting bound-bound radiative transitions are shown with black lines. Red lines correspond to diagnostic transitions used in abundance analysis. Only energy levels following L-S coupling are shown.
Current usage metrics show cumulative count of Article Views (full-text article views including HTML views, PDF and ePub downloads, according to the available data) and Abstracts Views on Vision4Press platform.
Data correspond to usage on the plateform after 2015. The current usage metrics is available 48-96 hours after online publication and is updated daily on week days.
Initial download of the metrics may take a while.