Fig. 3.
Download original image
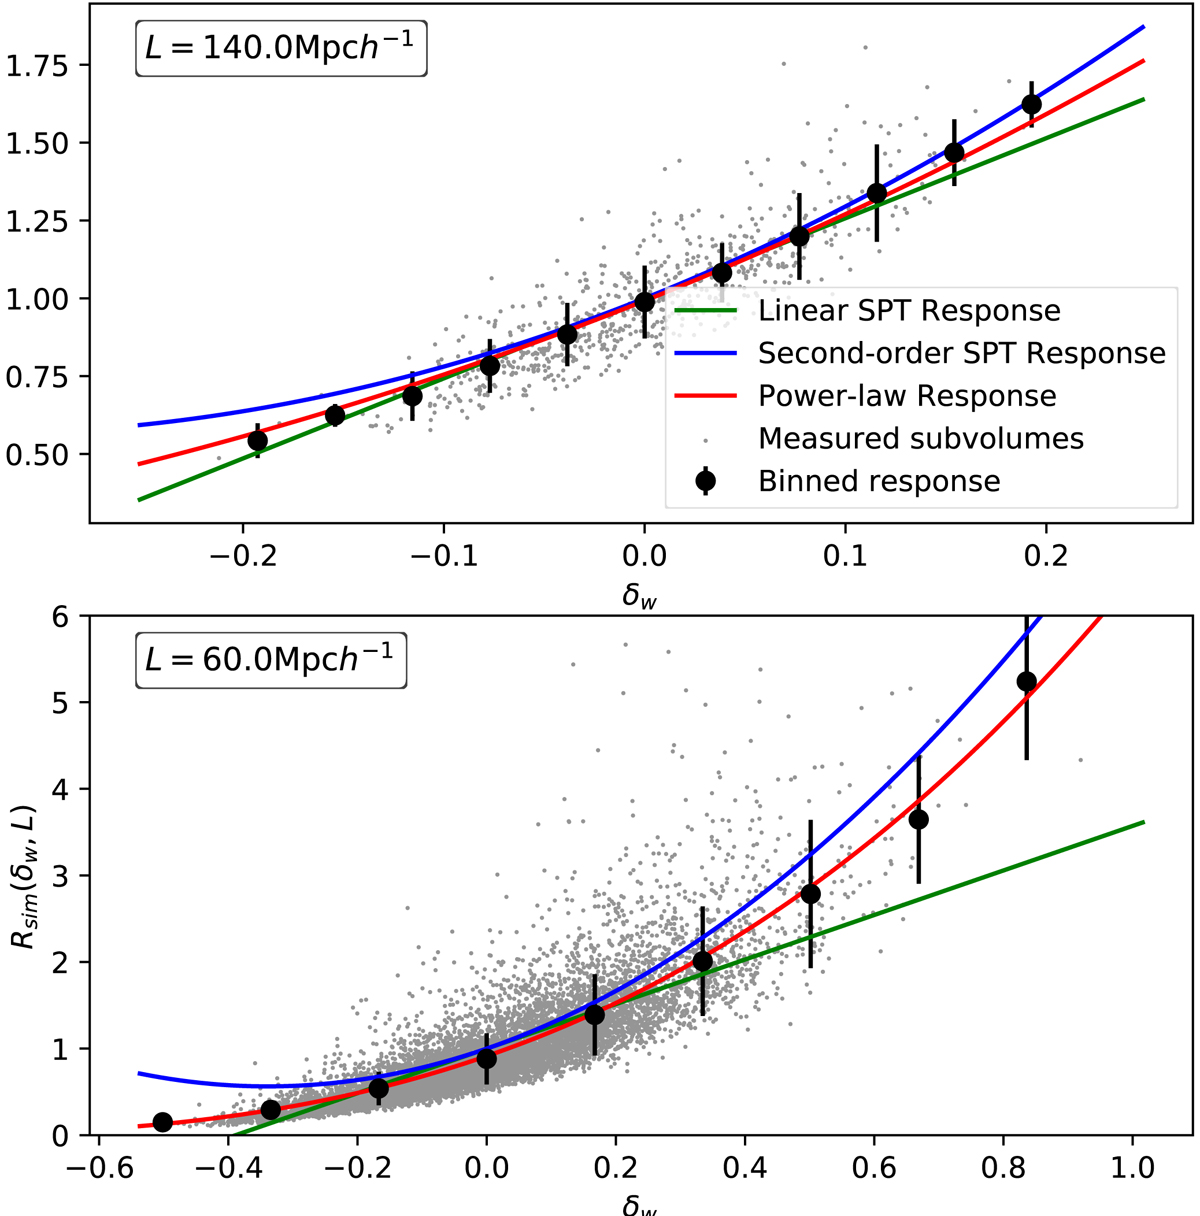
Simulated responses from our ΛCDM simulation with two different L window sizes at z = 0. The small gray markers represent the measured sub-volumes. This data have been re-binned, and the black circles with error bars represent the average response in each bin and the 1σ deviation. The linear (R = 1 + R1δw) and second-order (![]() ) responses from SPT are plotted with the green and blue curves, respectively. The red curves represent the new, σ-dependent power-law response.
) responses from SPT are plotted with the green and blue curves, respectively. The red curves represent the new, σ-dependent power-law response.
Current usage metrics show cumulative count of Article Views (full-text article views including HTML views, PDF and ePub downloads, according to the available data) and Abstracts Views on Vision4Press platform.
Data correspond to usage on the plateform after 2015. The current usage metrics is available 48-96 hours after online publication and is updated daily on week days.
Initial download of the metrics may take a while.