Free Access
Fig. 12.
Download original image
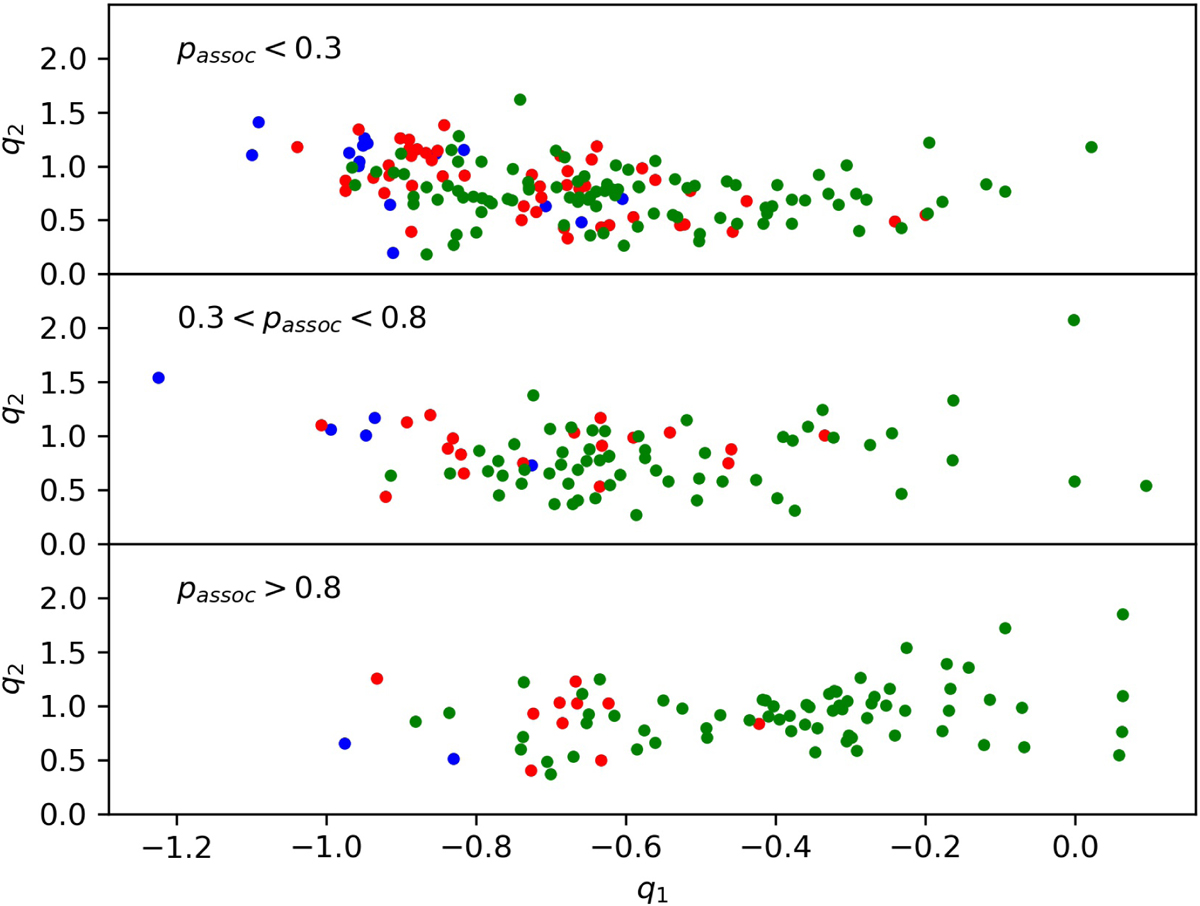
q1 − q2 for X-ray sources in the core region with color-coding as in Fig. 6 and separated into sources with association probability < 30% (upper panel), in the range 30%−80% (middle panel), and > 80% (lower panel); see text for more details.
Current usage metrics show cumulative count of Article Views (full-text article views including HTML views, PDF and ePub downloads, according to the available data) and Abstracts Views on Vision4Press platform.
Data correspond to usage on the plateform after 2015. The current usage metrics is available 48-96 hours after online publication and is updated daily on week days.
Initial download of the metrics may take a while.