Fig. 8.
Download original image
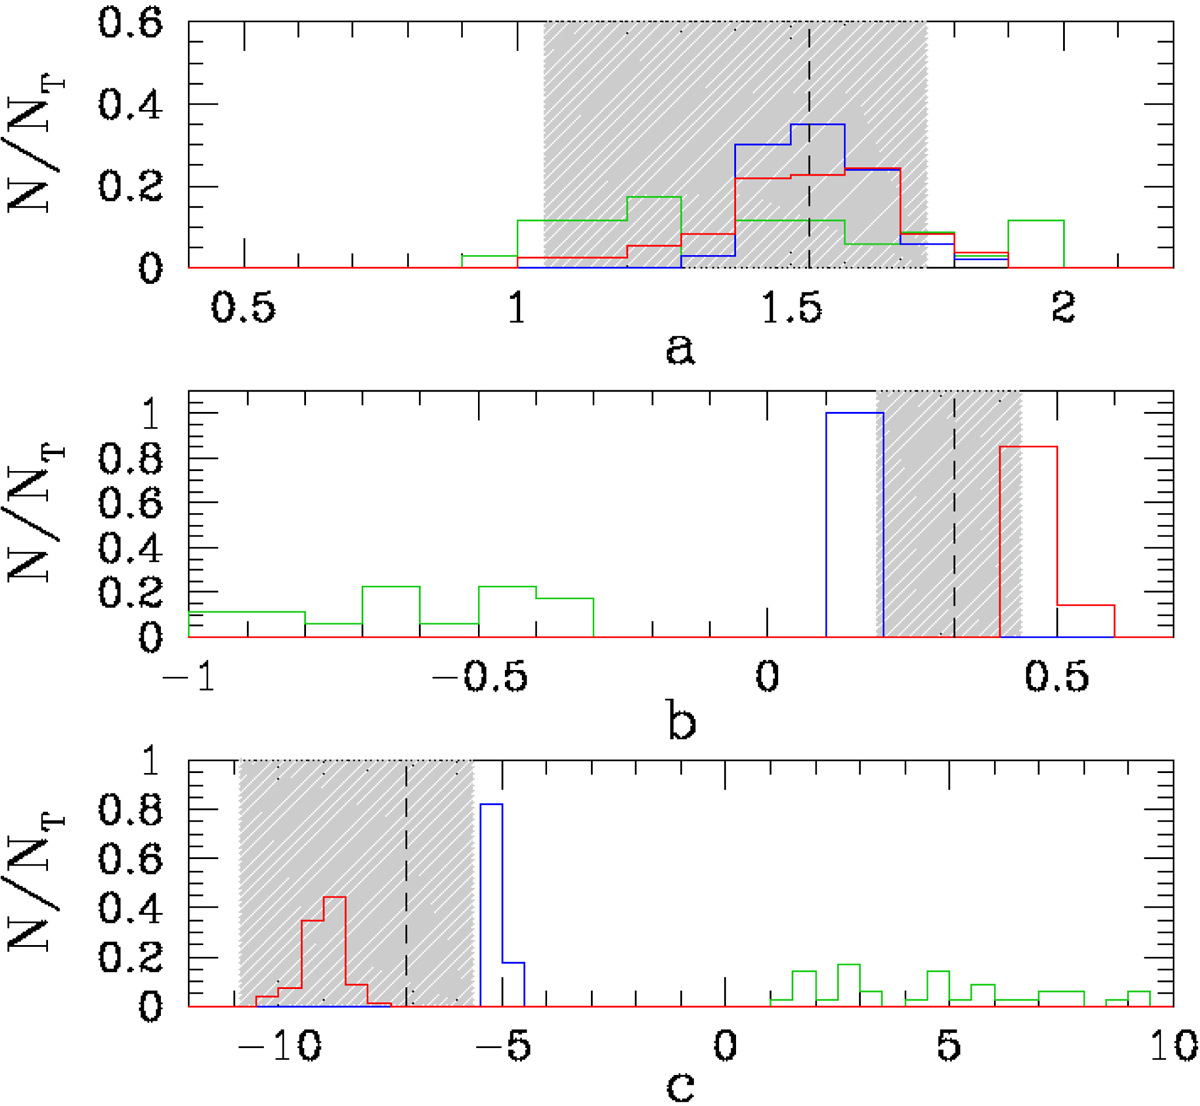
Histograms of the values of the FP-like coefficients a, b, and c. The green, blue, and red colors correspond to the three solutions found for β, respectively. The gray band in each plot marks the region of the coefficients obtained by D’Onofrio et al. (2008) for the fit of the FP of the different WINGS clusters. The dashed black lines are the average values of the FP-like coefficients obtained considering only solutions β2 (blue) and β3 (red), and discarding solution β1 (green) which clearly does not fit with the intervals of the measured FP coefficients.
Current usage metrics show cumulative count of Article Views (full-text article views including HTML views, PDF and ePub downloads, according to the available data) and Abstracts Views on Vision4Press platform.
Data correspond to usage on the plateform after 2015. The current usage metrics is available 48-96 hours after online publication and is updated daily on week days.
Initial download of the metrics may take a while.