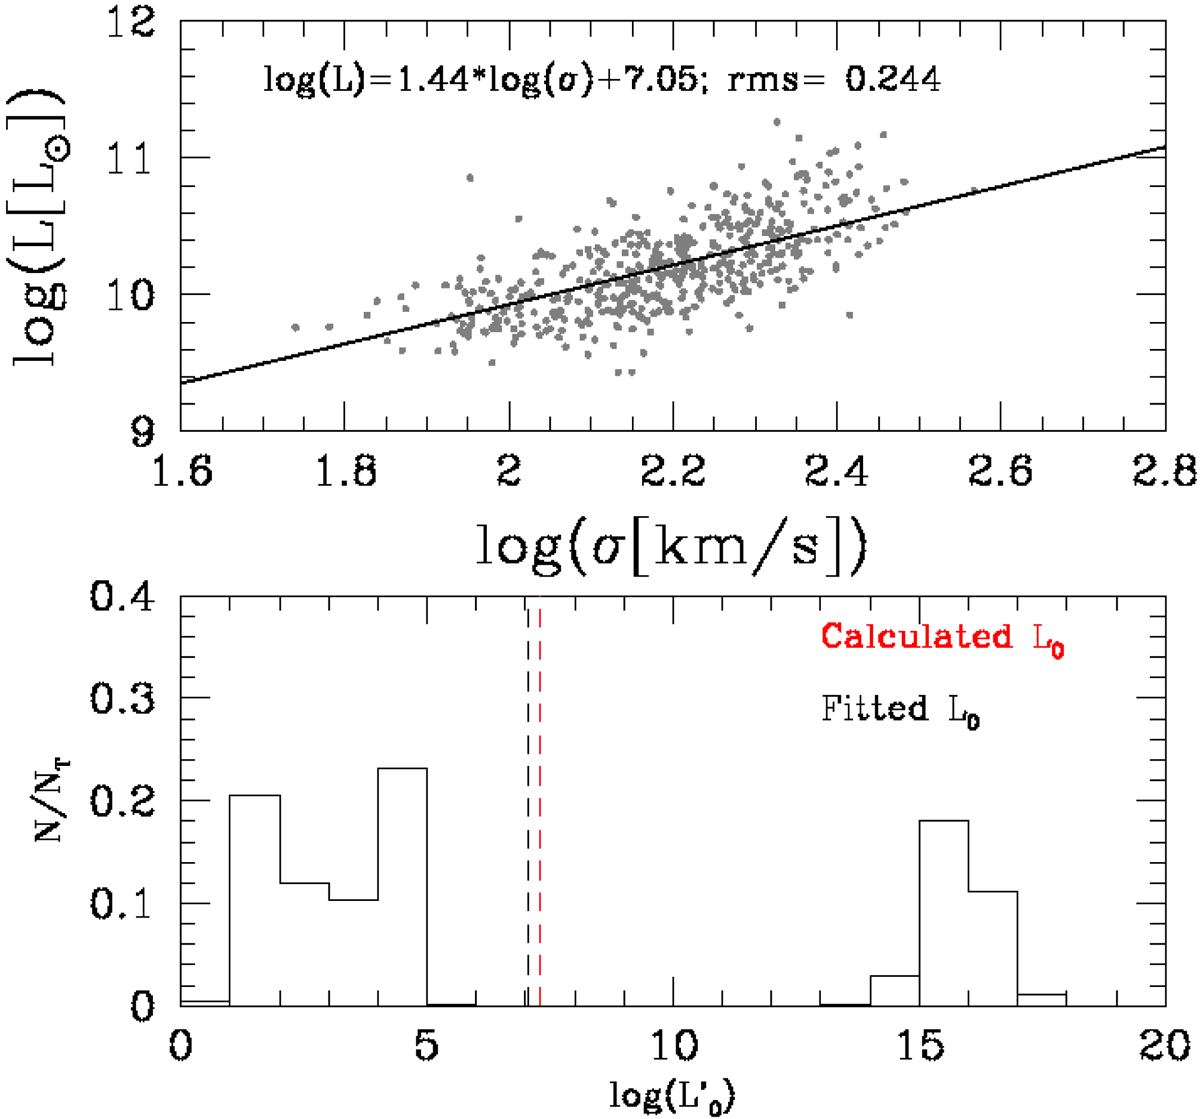
Fig. 7.
Download original image
Upper panel: FJ plane. The gray dots are the observational data and the solid black line is the least square fit. Bottom panel: histograms of the calculated values of ![]() starting from the solution for β. The average value of
starting from the solution for β. The average value of ![]() considering all the solutions is marked by the red dashed line, while the value obtained from the fit of the FJ relation is marked by the black line.
considering all the solutions is marked by the red dashed line, while the value obtained from the fit of the FJ relation is marked by the black line.
Current usage metrics show cumulative count of Article Views (full-text article views including HTML views, PDF and ePub downloads, according to the available data) and Abstracts Views on Vision4Press platform.
Data correspond to usage on the plateform after 2015. The current usage metrics is available 48-96 hours after online publication and is updated daily on week days.
Initial download of the metrics may take a while.