Free Access
Fig. 6.
Download original image
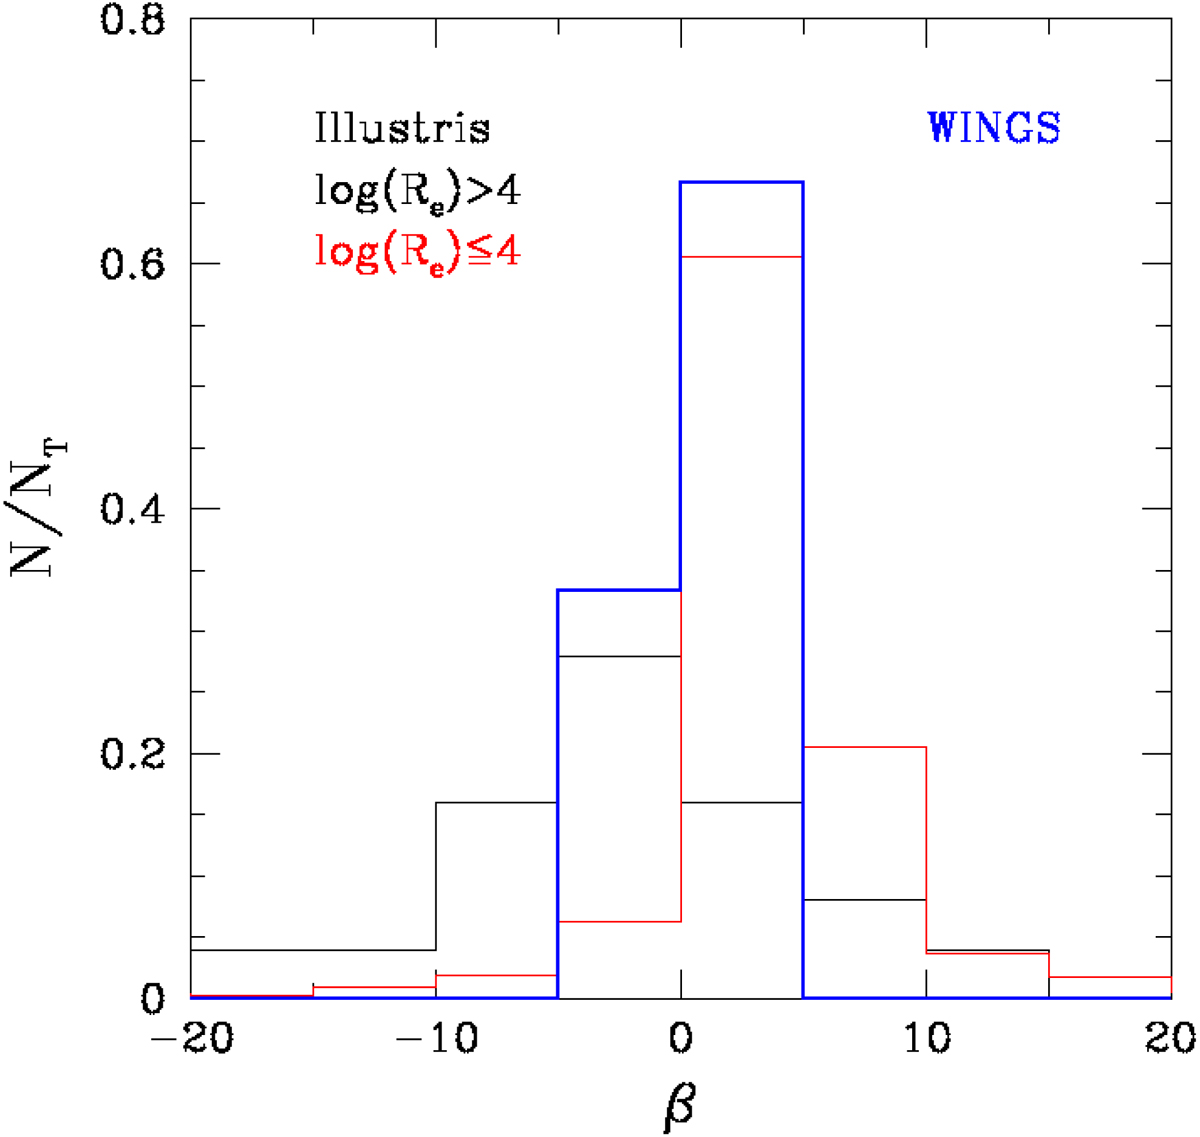
Histogram of the calculated values of β marked with a blue line. The values of β from the Illustris simulation are shown in two histograms with black and red colors to distinguish objects with log Re > 4 and log Re ≤ 4, respectively.
Current usage metrics show cumulative count of Article Views (full-text article views including HTML views, PDF and ePub downloads, according to the available data) and Abstracts Views on Vision4Press platform.
Data correspond to usage on the plateform after 2015. The current usage metrics is available 48-96 hours after online publication and is updated daily on week days.
Initial download of the metrics may take a while.