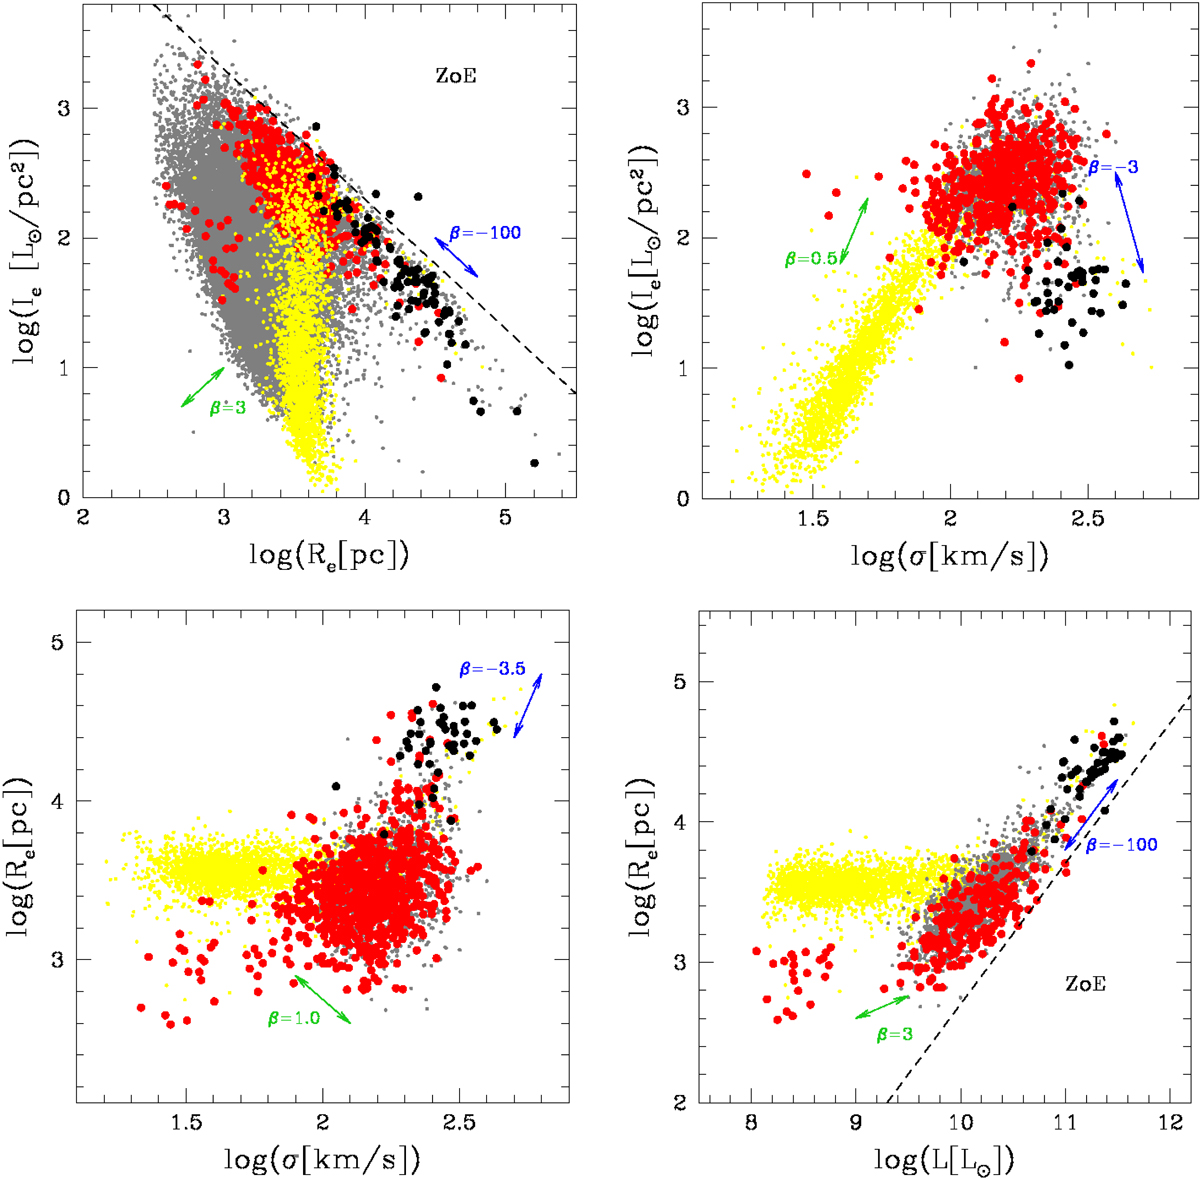
Fig. 4.
Download original image
Four different projections of the FP. The yellow dots mark the data of the Illustris simulation. The red dots are the sample with available stellar masses and velocity dispersion. The black dots are the BCG and second brightest ETGs of the clusters. The gray small dots are the optical and spectroscopic data for the objects that do not have a measured stellar mass. The dashed lines mark the region of the ZoE. The green and blue arrows mark the direction of a future evolution expected on the basis of the values of β. The green (blue) color indicates a positive (negative) value of β.
Current usage metrics show cumulative count of Article Views (full-text article views including HTML views, PDF and ePub downloads, according to the available data) and Abstracts Views on Vision4Press platform.
Data correspond to usage on the plateform after 2015. The current usage metrics is available 48-96 hours after online publication and is updated daily on week days.
Initial download of the metrics may take a while.