Fig. 1.
Download original image
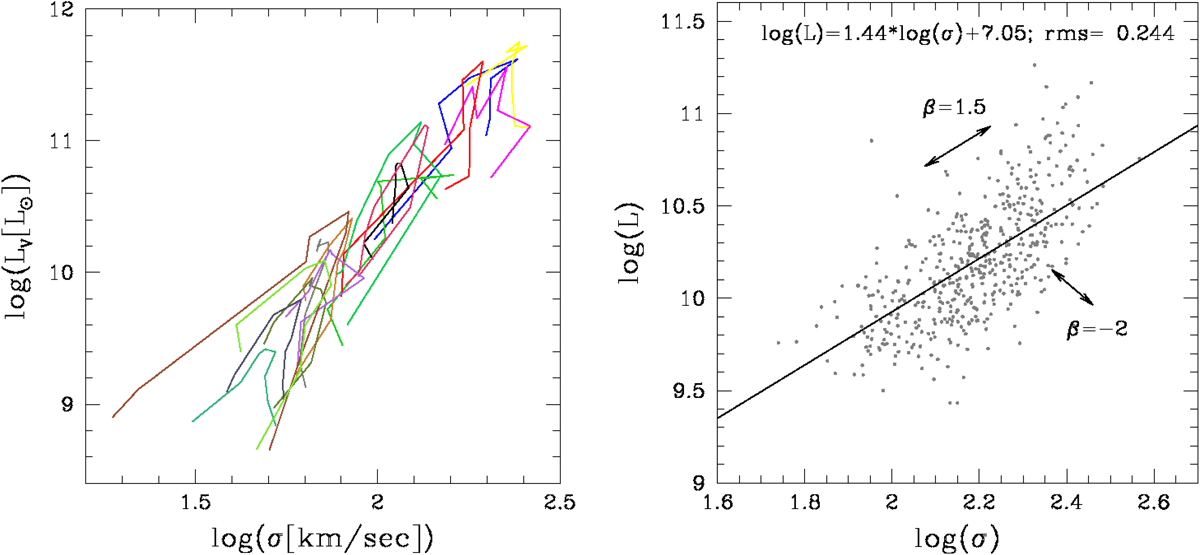
The L − σ plane. Left panel: the L − σ plane filled by few simulated ETGs followed by the Illustris simulation from z = 4 to z = 0. Each color marks the path of a single galaxy. Right panel: observed L − σ plane. Gray dots are the ETGs with available σ in our sample. The solid line is the least square fit. The arrow shows the direction of motion for two different values of β.
Current usage metrics show cumulative count of Article Views (full-text article views including HTML views, PDF and ePub downloads, according to the available data) and Abstracts Views on Vision4Press platform.
Data correspond to usage on the plateform after 2015. The current usage metrics is available 48-96 hours after online publication and is updated daily on week days.
Initial download of the metrics may take a while.