Fig. 6
Download original image
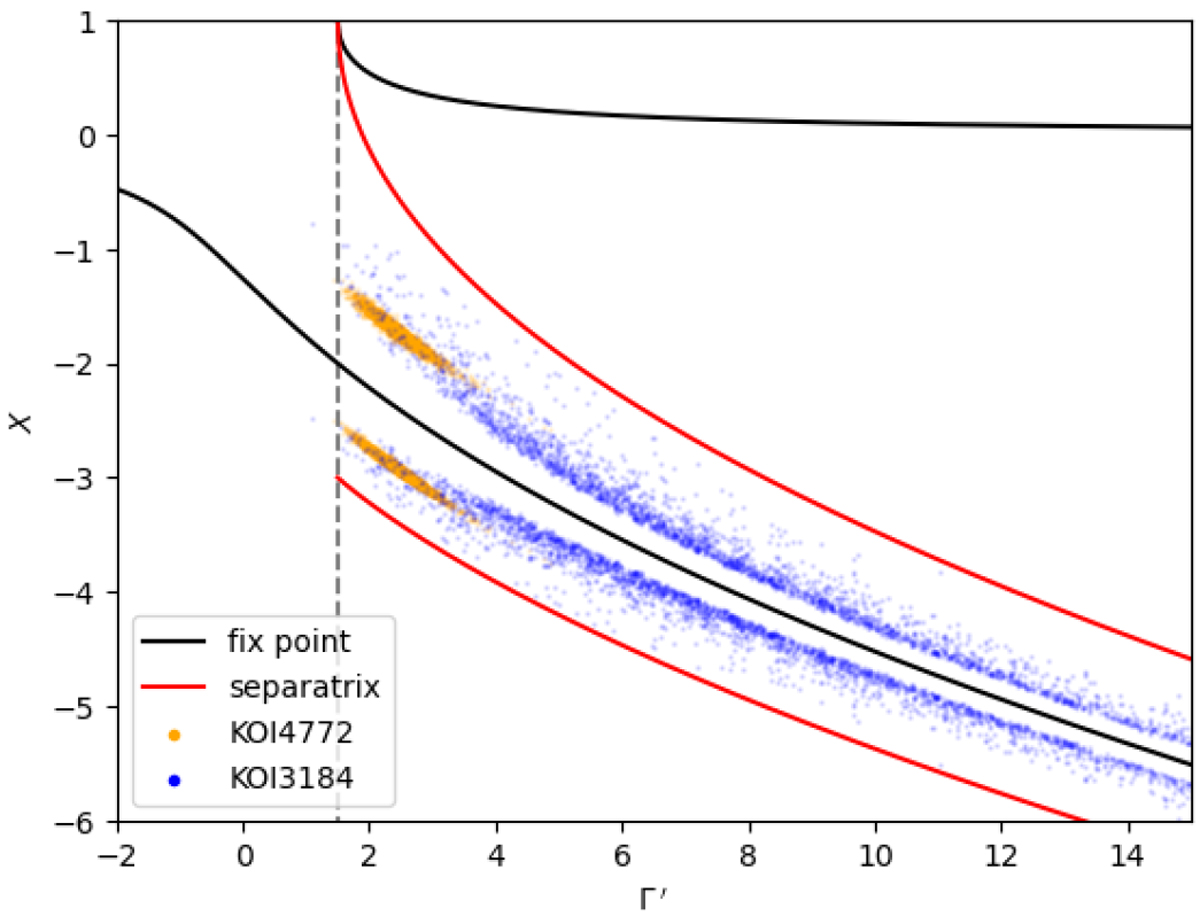
Surface of a section in the (Γ′,X) plane of the Hamiltonian (2). The black line shows the positions of the family of elliptic fixed points (the hyperbolic family exists for larger values of X and is not displayed here). The red line shows the intersection of the separatrix with the Y = 0 plane for each value of Γ′. The coloured dots show the intersection of the trajectories emanating from the initial conditions of the posterior summarised in Sect. 2 and the (Γ′, X) plane, for Kepler-1972 (this paper) and Kepler-1705 (Leleu et al. 2021b).
Current usage metrics show cumulative count of Article Views (full-text article views including HTML views, PDF and ePub downloads, according to the available data) and Abstracts Views on Vision4Press platform.
Data correspond to usage on the plateform after 2015. The current usage metrics is available 48-96 hours after online publication and is updated daily on week days.
Initial download of the metrics may take a while.