Fig. 3
Download original image
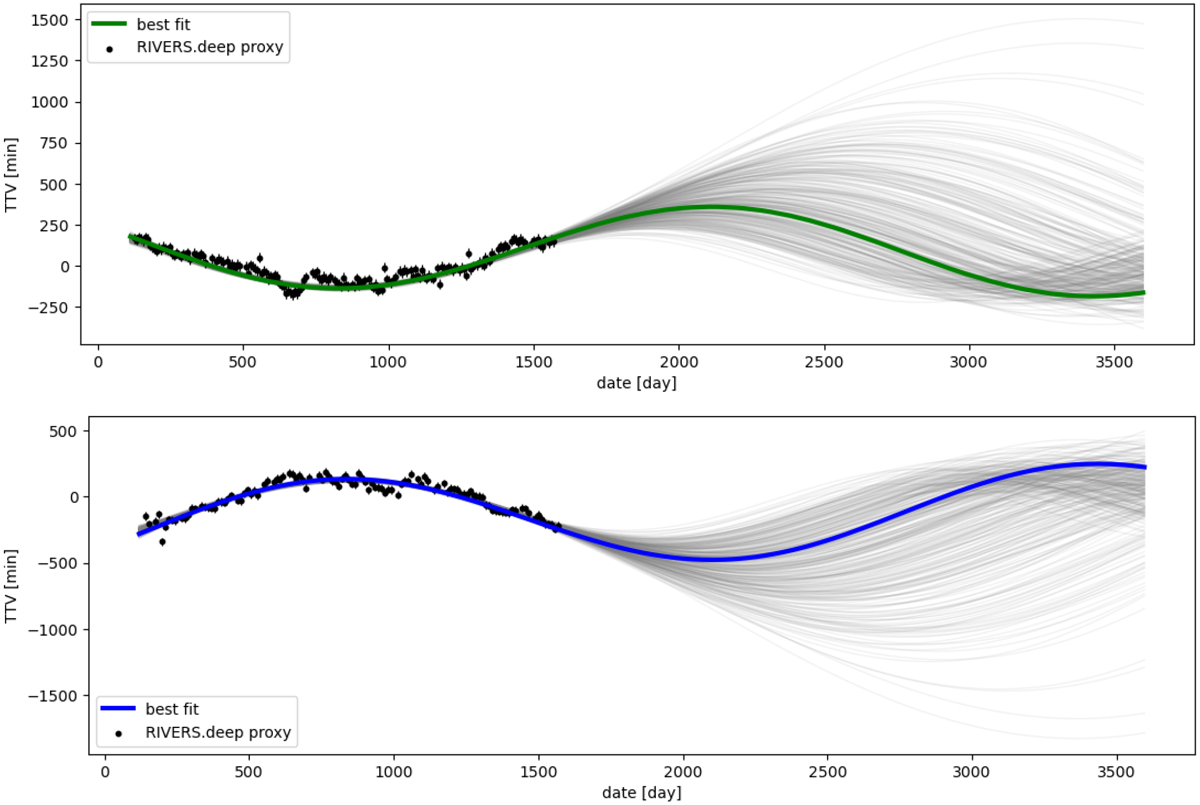
TTVs for Kepler-1972 b (top) and Kepler-1972 c (bottom). The black error bars represent the TTVs coming from the RIVERS.deep method which is the network’s highest confidence for the timing of each transit (highlighted pixels in Fig. 1). These timings are used as TTV proxies to initialise the photodynamical fit close to its final solution, but are not transit timings fitted to the data. Their error bars indicate the sensitivity of the method (30 min). We show 300 samples resulting from the photodynamic fit of the light curve in grey, and the solid coloured curves correspond to the best fit.
Current usage metrics show cumulative count of Article Views (full-text article views including HTML views, PDF and ePub downloads, according to the available data) and Abstracts Views on Vision4Press platform.
Data correspond to usage on the plateform after 2015. The current usage metrics is available 48-96 hours after online publication and is updated daily on week days.
Initial download of the metrics may take a while.