| Issue |
A&A
Volume 661, May 2022
|
|
|---|---|---|
| Article Number | A67 | |
| Number of page(s) | 6 | |
| Section | Extragalactic astronomy | |
| DOI | https://doi.org/10.1051/0004-6361/202142520 | |
| Published online | 03 May 2022 | |
Ionization of He II in star-forming galaxies by X-rays from cluster winds and superbubbles
1
Institute for Physics and Astronomy, University Potsdam, 14476 Potsdam, Germany
e-mail: lida@astro.physik.uni-potsdam.de
2
Observatoire de Genève, Département d’Astronomie, Université de Genève, 51 chemin Pegasi, 1290 Versoix, Switzerland
3
CNRS, IRAP, 14 avenue E. Belin, 31400 Toulouse, France
Received:
25
October
2021
Accepted:
3
March
2022
The nature of the sources powering nebular He II emission in star-forming galaxies remains debated, and various types of objects have been considered, including Wolf-Rayet stars, X-ray binaries, and Population III stars. Modern X-ray observations show the ubiquitous presence of hot gas filling star-forming galaxies. We use a collisional ionization plasma code to compute the specific He II ionizing flux produced by hot gas and show that if its temperature is not too high (≲2.5 MK), then the observed levels of soft diffuse X-ray radiation could explain He II ionization in galaxies. To gain a physical understanding of this result, we propose a model that combines the hydrodynamics of cluster winds and hot superbubbles with observed populations of young massive clusters in galaxies. We find that in low-metallicity galaxies, the temperature of hot gas is lower and the production rate of He II ionizing photons is higher compared to high-metallicity galaxies. The reason is that the slower stellar winds of massive stars in lower-metallicity galaxies input less mechanical energy in the ambient medium. Furthermore, we show that ensembles of star clusters up to ∼10−20 Myr old in galaxies can produce enough soft X-rays to induce nebular He II emission. We discuss observations of the template low-metallicity galaxy I Zw 18 and suggest that the He II nebula in this galaxy is powered by a hot superbubble. Finally, appreciating the complex nature of stellar feedback, we suggest that soft X-rays from hot superbubbles are among the dominant sources of He II ionizing flux in low-metallicity star-forming galaxies.
Key words: galaxies: ISM / galaxies: high-redshift / ISM: bubbles / X-rays: ISM
© ESO 2022
1. Introduction
A narrow nebular He IIλ4686 Å emission line is observed in many low-metallicity (low-Z) star-forming galaxies, implying the presence of sources emitting copious amount of He+ ionizing photons, which are not expected from normal stellar populations. (e.g., Guseva et al. 2000; Shirazi & Brinchmann 2012) The nature of these sources remains mysterious, and different proposed explanations are under debate.
Hot Wolf-Rayet (WR) stars, stars stripped in binary interactions, or binary systems in general have been suggested as possible sources of He+ ionizing photons (e.g., Schaerer 1996; Dionne & Robert 2006; Szécsi et al. 2015; Götberg et al. 2019; Sander & Vink 2020; Doughty & Finlator 2021). Other authors have proposed the presence of very metal-poor or supermassive stars (Cassata et al. 2013; Kehrig et al. 2015), radiative shocks (Thuan & Izotov 2005; Izotov et al. 2012; Plat et al. 2019), or other mechanisms (Barrow 2020; Pérez-Montero et al. 2020) to explain nebular He II emission at low metallicity.
Recently, high-mass X-ray binaries (HMXBs) that consist of a neutron star or a black hole accreting matter lost by a massive star donor have received special attention. Among them, the ultraluminous X-ray sources (ULXs) have the highest X-ray luminosities (which we define throughout this paper to be in the 0.3–10.0 keV energy range), LX ≳ 1039 erg s−1. He II and He III nebulae are commonly observed around ULXs (e.g., Pakull & Mirioni 2002, 2003; Moon et al. 2011; Binder et al. 2018).
Among galaxies with similar star-formation rates (SFRs), a higher X-ray output is produced by HMXBs in galaxies with lower metallicities (Mineo et al. 2012; Lehmer et al. 2021). Noting this trend and the similarity of the metallicity dependence of the He II/Hβ line intensity, Schaerer et al. (2019) suggested that He II nebulae in star-forming galaxies are ionized by ULXs. However, the recognition of ULXs as prime ionizing sources in He II emitting galaxies is debated. For example, Kehrig et al. (2015, 2021) argue that the ULX radiation is insufficient to explain the observed He II emission in the well-studied low-Z galaxy I Zw 18 (although new integral field spectroscopic observations provide a less definite answer on this issue; see Rickards Vaught et al. 2021). Also, Oskinova et al. (2019) show that the contribution of ULXs to the He II ionization in the starburst galaxy ESO 338-4 is small. From observations of 18 high-redshift galaxies, Saxena et al. (2020) conclude that HMXBs and weak (or obscured) active galactic nuclei are unlikely to be the dominant producers of He+ ionizing photons in these galaxies.
Finally, using simple photoionization models that combine HMXBs described by a multicolor disk model with a normal stellar population, Senchyna et al. (2020) have concluded that HMXBs are inefficient He II ionizing photon producers. However, Simmonds et al. (2021) challenge this conclusion on an empirical basis and using photoionization models, pointing out that the ionizing flux strongly depends on the poorly known shape of the spectral energy distribution (SED) of the ULXs. Clearly, the impact of compact X-ray sources on the interstellar medium (ISM) in galaxies needs further studies. In addition, other sources and emission processes may also be of importance.
In this article we introduce a model that explains He II emission in star-forming galaxies via the radiative output of star cluster winds and associated superbubbles. The paper is organized as follows. The observations of hot diffuse gas in galaxies are reviewed in Sect. 2. The specific He II ionizing flux produced by hot plasma is calculated in Sect. 3. The parameterizations of the temperature, the luminosity of cluster winds and superbubbles, and the He II ionization parameter are presented in Sect. 4. The populations of star clusters are incorporated in the model in Sect. 5. Section 6 provides a comparison of the model predictions with observations. The summary of this work is given in Sect. 7.
2. Empirical scaling between the X-ray luminosity of hot diffuse gas and the star-formation rate in galaxies
Young massive star clusters drive winds and blow superbubbles filled by hot gas (Mac Low & McCray 1988; Strickland et al. 2004; Silich et al. 2005; Keller et al. 2014; Kavanagh et al. 2020). Fortunately, the subarcsecond angular resolution offered by the Chandra telescope allows X-ray point sources, localized areas of diffuse X-ray emission (e.g., supernova remnants), and hot extended superbubbles in star-forming galaxies to be disentangled.
A large sample containing 21 local galaxies with SFRs between ∼0.1 and ∼20 M⊙ yr−1 and a broad range of stellar masses was studied by Mineo et al. (2012). Hot diffuse gas was detected in all sample galaxies. Their X-ray spectra have at least one soft spectral component that could be modeled as originating from plasma with a temperature 〈kT ≈ 0.24 keV (∼2.8 MK). Mineo et al. (2012) derive the intrinsic luminosity of hot gas in their sample galaxies using the MEKAL plasma models (Mewe et al. 1985) as LX(0.3−10 keV)/SFR ≈ 7 × 1039 erg s−1 (M⊙ yr−1)−1. An even larger sample of 49 galaxies with various morphological types was studied by Smith et al. (2018, 2019), who found that  erg s−1 (M⊙ yr−1)−1.
We take these empirical measurements as a guidance to approximate the scaling between the total X-ray luminosity of diffuse hot gas in a star-forming galaxy and its SFR as
![$$ \begin{aligned} \log (L_{\rm X}/\mathrm{SFR}) \approx 39.8 \ \ \ \ [\mathrm{erg\,s}^{-1}/(M_\odot \,\mathrm{yr}^{-1})]. \end{aligned} $$](/articles/aa/full_html/2022/05/aa42520-21/aa42520-21-eq2.gif)
3. He II ionizing flux from hot thermal plasma
Following Schaerer et al. (2019), we introduce a specific ionizing parameter, q [erg−1], that describes the He II ionizing photon flux, Q(He+) [s−1], emitted by a hot plasma per X-ray luminosity, LX [erg s−1]:
In this paper we evaluate the He II ionizing photon flux in the 0.054–0.5 keV range, while the X-ray luminosity is in 0.3–10.0 keV range unless otherwise noted.
To evaluate the ionizing flux produced by a hot thermal plasma, we computed q as a function of the plasma temperature, T, and metallicity, Z, by using the Astrophysical Plasma Emission Code (APEC) for collisionally ionized plasma in the optically thin limit (Smith et al. 2001) as implemented in the most recent editions of the X-ray spectral fitting package Xspec (Arnaud et al. 1996). The results are shown in Fig. 1. One can see that q(T, Z) increases steeply with decreasing temperature and becomes independent of Z for T ≲ 0.2 keV.
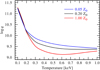 |
Fig. 1. Dependence of the parameter q (see Eq. (2)) on the plasma temperature for different metallicities, Z (see legend in the upper-right corner) according to the collisional plasma model APEC. |
According to Schaerer et al. (2019, and references therein), the ratio between the He II,λ4686 and Hβ line intensities in star-forming galaxies is
Substituting the empirical scaling relation Eq. (1) for LX yields

Remarkably, the predicted ratio is (nearly) independent of SFR, which is in accordance with observations (Schaerer et al. 2019, and references therein). As a next step, we made the implicit assumption that the metallicity of the hot gas is the same as the average galactic metallicity. The latter is often evaluated from nebular diagnostics (Kewley & Dopita 2002) and, therefore, characterizes the ISM in the vicinity of star-forming regions. Of course, stellar winds and multiple generations of supernovae (SNe) enrich the hot gas in the ISM. However, these effects are mild for bubbles around the “middle age” (≲10 Myr old) clusters we consider here (Cheng et al. 2021).
According to Fig. 1, at Z ≤ 0.2 Z⊙ and for a broad range of temperatures between 0.1 and 1.0 keV (1–11 MK) the parameter q is in the range 9.5 < log q < 11.5. Including this in Eq. (4), we obtain for such low-Z galaxies

(i.e., in the observed range; see, e.g., Fig. 1 in Schaerer et al. 2019). This implies that the hot plasma filling the ISM in low-Z star-forming galaxies is an important source of He II ionizing radiation.
4. Ionizing radiation from model cluster winds and superbubbles
The estimates made in the previous section (Sect. 3) show that the radiation from gas with temperatures 1–10 MK supplies a significant amount of He II ionizing photons. In star-forming galaxies such hot gas is found within superbubbles heated by the feedback from young massive star clusters. Below we consider how the feedback output from clusters changes during their evolution as well as its dependence on metallicity. Our goal is to establish the cluster age and metallicity that are most favorable for the production of He II ionizing photons. These predictions could be compared with observations of He II emitting galaxies and their star- and cluster-formation histories.
To estimate the temperature and the luminosity of a model star cluster wind, we used the Chevalier & Clegg (1985) hydrodynamic solutions coupled with stellar feedback parameters – kinetic energy input (Ė) and mass input (Ṁ) – prescribed by the Starburst99 model (Leitherer et al. 1999). For clarity, we assumed an instantaneous starburst. According to the formalism developed in Oskinova (2005), within the mass and energy production region of radius R ∼ 200 pc, the emission measure and the temperature of hot gas is E M(t) ∝ Ṁ3(αĖ)−1 and T(t) ∝ αĖṀ−1. The thermalization efficiency parameter, α, was introduced to account for various uncertainties on energy balance (Chevalier & Clegg 1985; Stevens & Hartwell 2003).
While simple, this approach allows us to investigate in a controlled manner how X-ray properties of a star cluster depend on its age, mass, and metallicity1. There are, however, some important shortcomings. The Chevalier & Clegg (1985) solutions are highly idealized and do not account for such important physical processes as turbulence, ISM inhomogeneity, or thermal conduction. The choice of the parameter α is guided by the detailed hydrodynamic models of superbubbles. Gray et al. (2019) show that outflows generated by massive star clusters can undergo catastrophic cooling that suppresses adiabatic superwinds, and they demonstrate that such models produce stronger nebular line emission compared to adiabatic outflows. Recently, Lancaster et al. (2021) investigated the evolution of wind-blown bubbles in a turbulent ISM. Their three-dimensional hydrodynamic simulations show that turbulent mixing at the bubble-shell interface leads to highly efficient cooling, by which the vast majority of the input wind energy is radiated away. Only ∼1−10% of the energy input rate from the wind remains in the bubble, and the fraction of remaining energy decreases with time. Taking the Lancaster et al. (2021) model as a guidance, we set α = 0.05, the average fraction of energy input rate that is retained.
Furthermore, we introduced the parameter Ṁcool to account for uncertainties associated with mass loading, mixing, and evaporation such that the total rate of mass input is Ṁ = Ṁ* + Ṁcool [M⊙ yr−1], where Ṁ* is the rate of mass influx provided by stellar winds and SNe as retrieved from Starburst99. El-Badry et al. (2019) investigate the evaporation of gas into the bubble interior. They find that the evaporation increases the density and decreases the temperature by more than an order of magnitude. They conclude that the hot gas mass, momentum, and energy are set by the ambient interstellar density and the efficiency of nonlinear mixing at the bubble-shell interface. In their recent hydrodynamical models, Lancaster et al. (2021) use an input mass-loss rate per unit stellar mass that is five times higher than predicted by Starburst99. We follow a similar approach but, since Ṁcool is observationally poorly constrained, we chose a conservative estimate: in order to roughly account for the mass loading, we set Ṁcool = Ṁ* (i.e., double the predictions of Starburst99).
The Chevalier & Clegg (1985) solutions assume an adiabatic, stationary outflow and neglect the star cluster gravity. Therefore, the cluster mass enters only indirectly, via stellar feedback in the form of combined mass and energy deposited by stellar winds and SNe. As a star cluster evolves, so does its feedback. The evolution of the cluster wind’s X-ray luminosity and temperature at different metallicities is shown in Fig. 2. Interestingly, prior to the onset of SNe at ∼10 Myr, the temperature is lower at lower Z. To understand this, we recall that, according to our model, T(Z) ∝ Ė(Z)/Ṁ(Z), where both the mechanic energy, Ė(Z), and the mass input, Ṁ(Z), rates are retrieved from Starburst99. At the epoch when the mechanic energy input is dominated by stellar winds,  , with the average wind velocity (vwind) decreasing toward low Z (Leitherer et al. 1992). Hence, to first order,
  . At later times (> 10 Myr), when SNe overtake stellar winds in supplying the mass and energy, the temperature increases and becomes independent of Z.
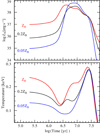 |
Fig. 2. X-rays from a model cluster of 106 M⊙ at different metallicities, assuming an instantaneous burst of star formation and a standard (Salpeter) initial mass function (computed according to Eqs. (3)–(7) in Oskinova 2005, but adopting α = 0.05 and Ṁcool = Ṁ*; see Sect. 4). Upper panel: dependence of X-ray luminosity on cluster age. The curves are smoothed to correct for the computational discontinuity of Starburst99 models for SN rates (see Leitherer et al. 1999). Lower panel: dependence of temperature on cluster age at different metallicities. |
Our simulations predict that when the model cluster becomes ∼3 Myr old, its associated X-ray output sharply increases. The characteristic time during which the X-ray luminosity is at its highest lasts for tc ∼ 10 Myr (upper panel in Fig. 2). During this epoch, a cluster with Mcl = 106 M⊙ powers  erg s−1. Then, assuming that the energy and mass inputs from massive star clusters to the ISM are self-similar and scale linearly with cluster mass,
![$$ \begin{aligned} \log (L^\mathrm{cl}_{\rm X} / M_{\rm cl} )=32.5 \ \ \ \ [\mathrm{erg}\,\mathrm{s}^{-1}\,M_\odot ^{-1}]. \end{aligned} $$](/articles/aa/full_html/2022/05/aa42520-21/aa42520-21-eq10.gif)
5. Diffuse X-ray emission from an ensemble of star clusters in a star-forming galaxy
In our model, the X-ray luminosity of hot gas in star-forming galaxies is powered by young massive clusters. In this section we consider whether this model can reproduce the correlation between X-ray luminosity and SFR that is well established empirically (Eq. (1)).
The total specific energy emitted in X-rays by a model star cluster with an age between ∼3 Myr and ∼13 Myr over the characteristic time tc = 10 Myr and per unit mass is
![$$ \begin{aligned} \log \left(L^\mathrm{cl}_{\rm X}/M_{\rm cl} \times t_{\rm c}\right) \equiv \log {\mathcal{T} _{\rm c}} \sim 47\,[\mathrm{erg}\,M_\odot ^{-1}]. \end{aligned} $$](/articles/aa/full_html/2022/05/aa42520-21/aa42520-21-eq11.gif)
These order of magnitude estimates are confirmed by the numeric integration over time of the  curves shown in the upper panel of Fig. 2: log𝒯c(Z⊙) = 47.40, log𝒯c(0.2 Z⊙) = 47.43, and log𝒯c(0.05 Z⊙) = 47.62.
The cluster-formation efficiency, Γ, is a measurement of the total stellar mass forming in bound star clusters with respect to the total stellar mass forming in the galaxy (Adamo et al. 2020, and references therein), such that the cluster-formation rate is
![$$ \begin{aligned} \mathrm{CFR}\equiv \Gamma \times \mathrm{SFR}\ \ \ \ [M_\odot \,\mathrm{yr^{-1}}]. \end{aligned} $$](/articles/aa/full_html/2022/05/aa42520-21/aa42520-21-eq13.gif)
According to Fig. 18 in Adamo et al. (2020), Γ ∼ 0.1−1, while on average Γ ∼ 0.3. As a next step, we estimated the total X-ray luminosity of diffuse gas in a galaxy heated by cluster feedback for a given episode of star formation. Combining Eqs. (7) and (8), we have
![$$ \begin{aligned} L_{\rm X}= 3.17\times 10^{-8}\times \Gamma \times \mathrm{SFR}\times {\mathcal{T} }_{\rm c} \ \ \ \ \ [\mathrm{erg\,s}^{-1}]. \end{aligned} $$](/articles/aa/full_html/2022/05/aa42520-21/aa42520-21-eq14.gif)
Using log𝒯c = 47.6 and a cluster efficiency Γ = 0.3, this yields

thus recovering within ∼0.2 dex the empirical correlation between the X-ray luminosity of hot diffuse gas and the SFR in galaxies (Eq. (1)). Correspondingly, according to Eq. (3), the ratio between He II,λ4686 and Hβ line intensities becomes

in fair agreement with observations (see Fig. 1 and Sect. 2).
6. Comparison with observations of I Zw 18
I Zw 18 is one of the nearest (dI Zw 18 = 18.2 Mpc) and most metal-poor (ZI Zw 18 ≈ 0.02 Z⊙) dwarf galaxies. It contains two large H II regions ionized by star clusters with ages between a few to a hundred megayears (Hunter & Thronson 1995; Papaderos et al. 2002; Contreras Ramos et al. 2011; Rickards Vaught et al. 2021). I Zw 18 is filled with diffuse He II emission. From the observed luminosity in the He II,λ4686 line, Kehrig et al. (2015) estimate a rate of He II ionizing photons as log Q(He+) ≈ 50 [s−1].
Martin (1996) proposed that a superbubble is responsible for the ISM structure in I Zw 18. Assuming that the superbubble solely produces the He II ionizing flux, and invoking Eq. (2), log Q(He+) = log q + log LX ≈ 50. To assess whether this is realistic, we estimated the specific ionizing parameter, q. Annibali et al. (2013) show that the main body of I Zw 18 has been forming stars very actively over the past ∼10 Myr. The bulk of star clusters in I Zw 18 are therefore younger than 10–20 Myr. For clusters of such ages and metallicities, the temperature of hot plasma filling a superbubble is ∼0.1 keV (1 MK), implying log q ∼ 11 (Figs. 1 and 2). Correspondingly, log LX ∼ 39 [erg s−1] is sufficient to provide the required He II ionizing flux.
Annibali et al. (2013) derive for I Zw 18 an average SFR of ∼1 M⊙ yr−1 over the past ∼10 Myr and significantly less before that (we note that other methods find generally lower values, e.g., Lebouteiller et al. 2017). Adopting SFR ∼ 1 M⊙ yr−1, log LX ∼ 39 [erg s−1], which is broadly consistent with the predictions of Eqs. (1) and (10). These estimates show that the He II ionization in I Zw 18 can be explained by stellar feedback and the superbubble it produced.
This mechanism is consistent with observations. Recently, Kehrig et al. (2021) reviewed up-to-date multiwavelength observations of I Zw 18. The total X-ray luminosity of this galaxy, LX(0.5−8.0 keV)≳1040 erg s−1, is dominated by a HMXB associated with the most populous northwestern star-forming region. The HMXB experiences state transitions over a timescale of years, but so far its luminosity has always exceeded 1039 erg s−1. While XMM-Newton yields excellent spectra of the HMXB, only Chandra can resolve the point and diffuse X-ray sources in I Zw 18.
Indeed, Thuan et al. (2004) reported the discovery of extended X-ray emission in the main body of I Zw 18. Since only ≈23 counts from this diffuse emission were measured, its spectrum cannot be well constrained. To determine the X-ray flux, Thuan et al. (2004) adopted the neutral hydrogen column density of NH = 1.3 × 1021 cm−2 and a thermal plasma model with 11.6 MK (see their Table 1). This results in FX(0.5−10.0 keV)≈2 × 10⁻¹⁵ erg s−1 cm−2 and LX(0.5−10.0 keV)≈5 × 1037 erg s−1.
However, according to our model the plasma temperature in I Zw 18 is significantly lower. Using the APEC model with 1.16 MK and Z = 0.02 Z⊙, the absorption-corrected X-ray luminosity of diffuse gas in I Zw 18 is  erg s−1, which is in agreement with our model predictions.
The extended X-ray radiation detected by Chandra is likely only a small fraction of the warm-hot gas filling this galaxy. At the distance of I Zw 18, the X-ray luminosity log LX ∼ 39 [erg s−1] corresponds to the unabsorbed flux FX = 2.5 × 10⁻¹⁴ erg cm−2 s−1. However, the relatively high column density severely hampers the ability to detect soft X-rays (Fig. 3). To check whether the existing X-ray observations are suitable for detecting the soft emission predicted by our model, we employed the current version of the tool ‘PIMMS v4.11a: with ACIS Pile up and Background Count Estimation’ provided by the Chandra X-Ray Center2. Unfortunately, Chandra Cycle 1 is not included in this version; therefore, we made estimates for the earliest available, Cycle 3. We assumed that the size of the superbubble is similar to the size of the central He II region (i.e., 600″2). The total background count rate of the ACIS-S detector in the 600″2 area is 5 × 10⁻⁴ s−1, which exceeds the count rate expected from a 1 MK degree superbubble in I Zw 18. Therefore, it is clear why the bulk of soft X-ray emission ionizing He II in I Zw 18 could not be detected by Chandra.
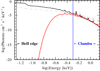 |
Fig. 3. Model spectra of diffuse X-ray emission in I Zw 18. The plasma model is by APEC, with Z = 0.02 Z⊙. The thick solid red line represents the model with kT = 0.1 keV and X-ray flux FX = 2 × 10⁻¹⁵ erg s−1 cm−2 in the 0.5–10.0 keV band (marked as Chandra in the plot), i.e., the same as reported by Thuan et al. (2004) for the extended X-ray emission. The ISM absorption model component (tbabs) corresponding to the foreground absorption toward I Zw 18, NH = 1.3 × 1021 cm−2, is applied. The thin dashed red line has the same meaning as the solid red line but for kT = 0.2 keV. The thick solid black line has the same meaning as the solid red line but without accounting for the ISM absorbing column toward I Zw 18. The X-ray luminosity in the 0.3–10 keV band is LX = 1039 erg s−1. The thin dashed black line has the same meaning as the solid black line but for kT = 0.2 keV. |
Importantly, radio observations confirm the presence of a superbubble in I Zw 18. The spatial distribution of the radio lobes, the extended X-ray emission, and the He II regions are remarkably similar (Hunt et al. 2005; Rickards Vaught et al. 2021; Kehrig et al. 2021). We conclude that the feedback from a few clusters that are < 10 Myr old could power superbubbles that emit radiation capable of sustaining the bulk of He II nebula emission in I Zw 18. Future combined hydrodynamic and radiative transfer models are needed to simulate the nebula He II emission maps and compare them to the observations.
7. Discussion and summary
We propose a model that explains nebular He II emission in star-forming galaxies with ionizing radiation produced by superbubbles. We show that when the plasma temperature is sufficiently low (kT ≲ 0.2 keV), the specific He II ionizing flux log q > 10, which is sufficiently high to reproduce the ratio between He II,λ4686 and Hβ line intensities observed in star-forming galaxies.
At temperatures of a few megakelvins, which are typical for hot superbubbles, helium is collisionally ionized. According to the calculations of ionization balance in the collisional ionization equilibrium gas, at temperatures above 1 MK all helium is in the H III ionization stage (the fraction of H II is > 5 orders of magnitude lower than the fraction of He III; Sutherland & Dopita 1993). Therefore, strong emission in the He IIλ4686 line within the bubbles is not expected.
In order to gain a physical understanding, we developed a simple model based on the hydrodynamic solutions for cluster winds coupled with the output of Starburst99 models (see Sect. 4). We find that slower stellar winds at lower Z lead to lower energy input, and consequently lower temperatures of hot gas, and result in a higher output of He II ionizing photons (Figs. 1 and 2).
To estimate the X-ray luminosities of cluster winds and associated superbubbles, we made two strong assumptions on cooling and mass loading. For quantitative estimates, we adopted the low thermalization efficiency parameter α = 0.05 and doubled the rate of mass input compared to the predictions of Starburst99 models. As discussed in Lancaster et al. (2021), the stronger cooling is favored in the regions with higher ambient density. It remains to be seen whether these conditions are fulfilled in galaxies that emit nebular He II spectra.
In order to estimate the He II ionizing power of the whole ensemble of young star clusters in a star-forming galaxy, we assumed that superbubbles are self-similar and that their X-ray luminosities are proportional to the mass of the cluster (we only considered massive clusters capable of driving winds when a few megayears old). We show that the X-ray luminosity of hot diffuse gas in a galaxy is proportional to its SFR as log LX ≈ logSFR + 39.6 erg s−1, similar to observations. According to our model, the observed prevalence of He II nebulae in low-Z galaxies is due to the combination of (1) lower temperatures of superbubbles and (2) the linear scaling between the X-ray output star clusters and the SFR of their host galaxy (Eqs. (6)–(11)). To test our model, we considered the template low-Z galaxy I Zw 18 and find that He II ionization in this galaxy could be powered by a hot superbubble.
The approach we follow in this paper is simple – we used a single-temperature hot bubble as a source of ionizing photons and did not consider the effects of radiative transfer. The gas temperature determines the SED of radiation emitted by the bubble. In realistic superbubbles the plasma is multi-temperature and could be out of collisional equilibrium (Kavanagh et al. 2020). These effects should be included in future detailed modeling. The SED of the radiation source does not only matter for estimating the direct number of He II ionizing photons it produces: the energies of photoelectrons also depend on the SED, and secondary electrons may also contribute to the ionization (Valdés & Ferrara 2008). These effects are, however, difficult to model for He II.
Furthermore, in star-forming galaxies the ISM has a complex distribution. This could have a non-negligible effect on the propagation of ionizing photons (Eide et al. 2018; Glatzle et al. 2019). The final predictions of line intensities might be significantly affected by radiative transfer through gas and dust. Hence, computing the intrinsic ionizing flux is only the first step of a process investigating radiative feedback. Further work on radiative transfer simulations is required to connect the intrinsic X-rays fluxes with the observed He II nebula lines.
Superbubbles are not the only objects that produce He II ionizing flux in star-forming galaxies. The emission of various objects that coexist in a superstar cluster that is a few megayears old into the He+ ionizing flux is presented in Table 1. The He II ionizing power of the hottest WR stars is orders of magnitude lower than that of a superbubble. To produce numbers of He II ionizing photons comparable to that produced by a superbubble with kT = 0.2 keV and LX = 1040 erg s−1, at least ∼50 very hot WR stars would be needed. Alternatively, a single ULX with LX ∼ 1040 erg s−1 and a sufficiently soft spectrum could also power the observed He II recombination lines (see Simmonds et al. 2021).
He II ionizing rate in different types of objects coexisting in a superstar cluster older than ∼5 Myr.
To conclude, we make the falsifiable prediction that the temperature in superbubbles around 2–10 Myr old superstar clusters is lower in lower-Z galaxies. The model we suggest here paves the way for stellar feedback simulations that account consistently for evolution, hydrodynamics, and photoionization in star-forming galaxies that exhibit He II nebular emission.
After this manuscript was accepted, we became aware of the new models of X-ray emission (in the 0.5–2.0 keV band) from hot star cluster winds by Franeck et al. (2022).
Acknowledgments
Authors are grateful to the anonymous referee for the useful report that helped to improve the paper.
References
- Adamo, A., Zeidler, P., Kruijssen, J. M. D., et al. 2020, Space Sci. Rev., 216, 69 [Google Scholar]
- Annibali, F., Cignoni, M., Tosi, M., et al. 2013, AJ, 146, 144 [NASA ADS] [CrossRef] [Google Scholar]
- Arnaud, K. A. 1996, in Astronomical Data Analysis Software and Systems V, eds. G. H. Jacoby, & J. Barnes, ASP Conf. Ser., 101, 17 [NASA ADS] [Google Scholar]
- Barrow, K. S. S. 2020, MNRAS, 491, 4509 [NASA ADS] [CrossRef] [Google Scholar]
- Binder, B., Levesque, E. M., & Dorn-Wallenstein, T. 2018, ApJ, 863, 141 [NASA ADS] [CrossRef] [Google Scholar]
- Cassata, P., Le Fèvre, O., Charlot, S., et al. 2013, A&A, 556, A68 [NASA ADS] [CrossRef] [EDP Sciences] [Google Scholar]
- Cheng, Y., Wang, Q. D., & Lim, S. 2021, MNRAS, 504, 1627 [NASA ADS] [CrossRef] [Google Scholar]
- Chevalier, R. A., & Clegg, A. W. 1985, Nature, 317, 44 [Google Scholar]
- Contreras Ramos, R., Annibali, F., Fiorentino, G., et al. 2011, ApJ, 739, 74 [NASA ADS] [CrossRef] [Google Scholar]
- Dionne, D., & Robert, C. 2006, ApJ, 641, 252 [NASA ADS] [CrossRef] [Google Scholar]
- Doughty, C., & Finlator, K. 2021, MNRAS, 505, 2207 [NASA ADS] [CrossRef] [Google Scholar]
- Eide, M. B., Graziani, L., Ciardi, B., et al. 2018, MNRAS, 476, 1174 [NASA ADS] [CrossRef] [Google Scholar]
- El-Badry, K., Ostriker, E. C., Kim, C.-G., Quataert, E., & Weisz, D. R. 2019, MNRAS, 490, 1961 [CrossRef] [Google Scholar]
- Franeck, A., Wünsch, R., Martínez-González, S., et al. 2022, ApJ, 927, 212 [NASA ADS] [CrossRef] [Google Scholar]
- Glatzle, M., Ciardi, B., & Graziani, L. 2019, MNRAS, 482, 321 [NASA ADS] [CrossRef] [Google Scholar]
- Götberg, Y., de Mink, S. E., Groh, J. H., Leitherer, C., & Norman, C. 2019, A&A, 629, A134 [NASA ADS] [CrossRef] [EDP Sciences] [Google Scholar]
- Gray, W. J., Oey, M. S., Silich, S., & Scannapieco, E. 2019, ApJ, 887, 161 [NASA ADS] [CrossRef] [Google Scholar]
- Guseva, N. G., Izotov, Y. I., & Thuan, T. X. 2000, ApJ, 531, 776 [NASA ADS] [CrossRef] [Google Scholar]
- Hunt, L. K., Dyer, K. K., & Thuan, T. X. 2005, A&A, 436, 837 [NASA ADS] [CrossRef] [EDP Sciences] [Google Scholar]
- Hunter, D. A., & Thronson, H. A. 1995, ApJ, 452, 238 [NASA ADS] [CrossRef] [Google Scholar]
- Izotov, Y. I., Thuan, T. X., & Privon, G. 2012, MNRAS, 427, 1229 [NASA ADS] [CrossRef] [Google Scholar]
- Kavanagh, P. J., Sasaki, M., Breitschwerdt, D., et al. 2020, A&A, 637, A12 [EDP Sciences] [Google Scholar]
- Kehrig, C., Vílchez, J. M., Pérez-Montero, E., et al. 2015, ApJ, 801, L28 [NASA ADS] [CrossRef] [Google Scholar]
- Kehrig, C., Guerrero, M. A., Vílchez, J. M., & Ramos-Larios, G. 2021, ApJ, 908, L54 [NASA ADS] [CrossRef] [Google Scholar]
- Keller, B. W., Wadsley, J., Benincasa, S. M., & Couchman, H. M. P. 2014, MNRAS, 442, 3013 [NASA ADS] [CrossRef] [Google Scholar]
- Kewley, L. J., & Dopita, M. A. 2002, ApJS, 142, 35 [Google Scholar]
- Lancaster, L., Ostriker, E. C., Kim, J.-G., & Kim, C.-G. 2021, ApJ, 914, 90 [NASA ADS] [CrossRef] [Google Scholar]
- Lebouteiller, V., Péquignot, D., Cormier, D., et al. 2017, A&A, 602, A45 [NASA ADS] [CrossRef] [EDP Sciences] [Google Scholar]
- Lehmer, B. D., Eufrasio, R. T., Basu-Zych, A., et al. 2021, ApJ, 907, 17 [NASA ADS] [CrossRef] [Google Scholar]
- Leitherer, C., Robert, C., & Drissen, L. 1992, ApJ, 401, 596 [Google Scholar]
- Leitherer, C., Schaerer, D., Goldader, J. D., et al. 1999, ApJS, 123, 3 [Google Scholar]
- Mac Low, M.-M., & McCray, R. 1988, ApJ, 324, 776 [NASA ADS] [CrossRef] [Google Scholar]
- Martin, C. L. 1996, ApJ, 465, 680 [NASA ADS] [CrossRef] [Google Scholar]
- Mewe, R., Gronenschild, E. H. B. M., & van den Oord, G. H. J. 1985, A&AS, 62, 197 [NASA ADS] [Google Scholar]
- Mineo, S., Gilfanov, M., & Sunyaev, R. 2012, MNRAS, 426, 1870 [NASA ADS] [CrossRef] [Google Scholar]
- Moon, D.-S., Harrison, F. A., Cenko, S. B., & Shariff, J. A. 2011, ApJ, 731, L32 [NASA ADS] [CrossRef] [Google Scholar]
- Oskinova, L. M. 2005, MNRAS, 361, 679 [NASA ADS] [CrossRef] [Google Scholar]
- Oskinova, L. M., Bik, A., Mas-Hesse, J. M., et al. 2019, A&A, 627, A63 [NASA ADS] [CrossRef] [EDP Sciences] [Google Scholar]
- Pakull, M. W., & Mirioni, L. 2002, ArXiv e-prints [arXiv:astro-ph/0202488] [Google Scholar]
- Pakull, M. W., & Mirioni, L. 2003, in Revista Mexicana de Astronomia y Astrofisica Conference Series, eds. J. Arthur, & W. J. Henney, 15, 197 [NASA ADS] [Google Scholar]
- Papaderos, P., Izotov, Y. I., Thuan, T. X., et al. 2002, A&A, 393, 461 [NASA ADS] [CrossRef] [EDP Sciences] [Google Scholar]
- Pérez-Montero, E., Kehrig, C., Vílchez, J. M., et al. 2020, A&A, 643, A80 [NASA ADS] [CrossRef] [EDP Sciences] [Google Scholar]
- Plat, A., Charlot, S., Bruzual, G., et al. 2019, MNRAS, 490, 978 [Google Scholar]
- Rickards Vaught, R. J., Sandstrom, K. M., & Hunt, L. K. 2021, ApJ, 911, L17 [NASA ADS] [CrossRef] [Google Scholar]
- Sander, A. A. C., & Vink, J. S. 2020, MNRAS, 499, 873 [Google Scholar]
- Saxena, A., Pentericci, L., Schaerer, D., et al. 2020, MNRAS, 496, 3796 [Google Scholar]
- Schaerer, D. 1996, ApJ, 467, L17 [NASA ADS] [CrossRef] [Google Scholar]
- Schaerer, D., Fragos, T., & Izotov, Y. I. 2019, A&A, 622, L10 [NASA ADS] [CrossRef] [EDP Sciences] [Google Scholar]
- Senchyna, P., Stark, D. P., Mirocha, J., et al. 2020, MNRAS, 494, 941 [CrossRef] [Google Scholar]
- Shirazi, M., & Brinchmann, J. 2012, MNRAS, 421, 1043 [NASA ADS] [CrossRef] [Google Scholar]
- Silich, S., Tenorio-Tagle, G., & Añorve-Zeferino, G. A. 2005, ApJ, 635, 1116 [NASA ADS] [CrossRef] [Google Scholar]
- Simmonds, C., Schaerer, D., & Verhamme, A. 2021, A&A, 656, A127 [NASA ADS] [CrossRef] [EDP Sciences] [Google Scholar]
- Smith, B. J., Campbell, K., Struck, C., et al. 2018, AJ, 155, 81 [NASA ADS] [CrossRef] [Google Scholar]
- Smith, B. J., Wagstaff, P., Struck, C., et al. 2019, AJ, 158, 169 [NASA ADS] [CrossRef] [Google Scholar]
- Smith, R. K., Brickhouse, N. S., Liedahl, D. A., & Raymond, J. C. 2001, ApJ, 556, L91 [Google Scholar]
- Stevens, I. R., & Hartwell, J. M. 2003, MNRAS, 339, 280 [NASA ADS] [CrossRef] [Google Scholar]
- Strickland, D. K., Heckman, T. M., Colbert, E. J. M., Hoopes, C. G., & Weaver, K. A. 2004, ApJ, 606, 829 [NASA ADS] [CrossRef] [Google Scholar]
- Sutherland, R. S., & Dopita, M. A. 1993, ApJS, 88, 253 [Google Scholar]
- Szécsi, D., Langer, N., Yoon, S.-C., et al. 2015, A&A, 581, A15 [NASA ADS] [CrossRef] [EDP Sciences] [Google Scholar]
- Thuan, T. X., & Izotov, Y. I. 2005, ApJS, 161, 240 [NASA ADS] [CrossRef] [Google Scholar]
- Thuan, T. X., Bauer, F. E., Papaderos, P., & Izotov, Y. I. 2004, ApJ, 606, 213 [NASA ADS] [CrossRef] [Google Scholar]
- Valdés, M., & Ferrara, A. 2008, MNRAS, 387, L8 [CrossRef] [Google Scholar]
All Tables
He II ionizing rate in different types of objects coexisting in a superstar cluster older than ∼5 Myr.
All Figures
|
Fig. 1. Dependence of the parameter q (see Eq. (2)) on the plasma temperature for different metallicities, Z (see legend in the upper-right corner) according to the collisional plasma model APEC. |
| In the text | |
|
Fig. 2. X-rays from a model cluster of 106 M⊙ at different metallicities, assuming an instantaneous burst of star formation and a standard (Salpeter) initial mass function (computed according to Eqs. (3)–(7) in Oskinova 2005, but adopting α = 0.05 and Ṁcool = Ṁ*; see Sect. 4). Upper panel: dependence of X-ray luminosity on cluster age. The curves are smoothed to correct for the computational discontinuity of Starburst99 models for SN rates (see Leitherer et al. 1999). Lower panel: dependence of temperature on cluster age at different metallicities. |
| In the text | |
|
Fig. 3. Model spectra of diffuse X-ray emission in I Zw 18. The plasma model is by APEC, with Z = 0.02 Z⊙. The thick solid red line represents the model with kT = 0.1 keV and X-ray flux FX = 2 × 10⁻¹⁵ erg s−1 cm−2 in the 0.5–10.0 keV band (marked as Chandra in the plot), i.e., the same as reported by Thuan et al. (2004) for the extended X-ray emission. The ISM absorption model component (tbabs) corresponding to the foreground absorption toward I Zw 18, NH = 1.3 × 1021 cm−2, is applied. The thin dashed red line has the same meaning as the solid red line but for kT = 0.2 keV. The thick solid black line has the same meaning as the solid red line but without accounting for the ISM absorbing column toward I Zw 18. The X-ray luminosity in the 0.3–10 keV band is LX = 1039 erg s−1. The thin dashed black line has the same meaning as the solid black line but for kT = 0.2 keV. |
| In the text | |
Current usage metrics show cumulative count of Article Views (full-text article views including HTML views, PDF and ePub downloads, according to the available data) and Abstracts Views on Vision4Press platform.
Data correspond to usage on the plateform after 2015. The current usage metrics is available 48-96 hours after online publication and is updated daily on week days.
Initial download of the metrics may take a while.