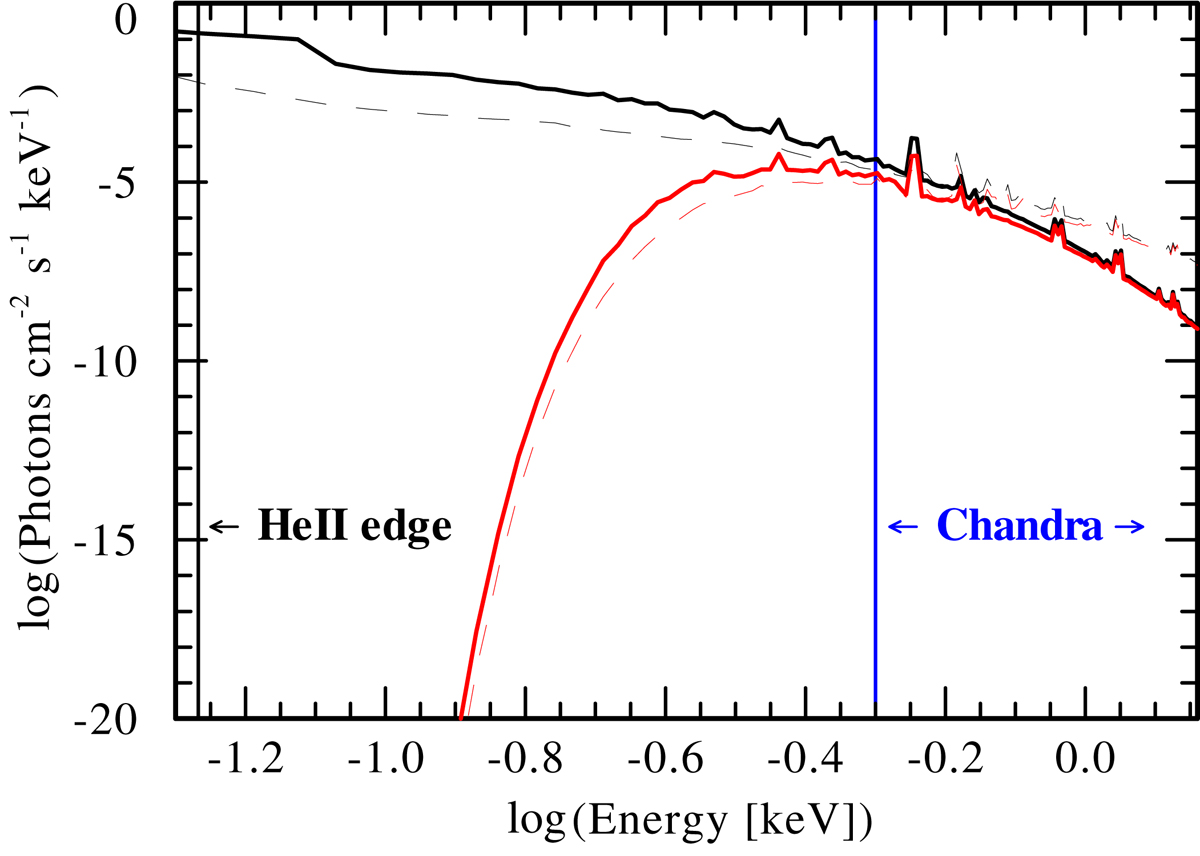
Fig. 3.
Download original image
Model spectra of diffuse X-ray emission in I Zw 18. The plasma model is by APEC, with Z = 0.02 Z⊙. The thick solid red line represents the model with kT = 0.1 keV and X-ray flux FX = 2 × 10⁻¹⁵ erg s−1 cm−2 in the 0.5–10.0 keV band (marked as Chandra in the plot), i.e., the same as reported by Thuan et al. (2004) for the extended X-ray emission. The ISM absorption model component (tbabs) corresponding to the foreground absorption toward I Zw 18, NH = 1.3 × 1021 cm−2, is applied. The thin dashed red line has the same meaning as the solid red line but for kT = 0.2 keV. The thick solid black line has the same meaning as the solid red line but without accounting for the ISM absorbing column toward I Zw 18. The X-ray luminosity in the 0.3–10 keV band is LX = 1039 erg s−1. The thin dashed black line has the same meaning as the solid black line but for kT = 0.2 keV.
Current usage metrics show cumulative count of Article Views (full-text article views including HTML views, PDF and ePub downloads, according to the available data) and Abstracts Views on Vision4Press platform.
Data correspond to usage on the plateform after 2015. The current usage metrics is available 48-96 hours after online publication and is updated daily on week days.
Initial download of the metrics may take a while.