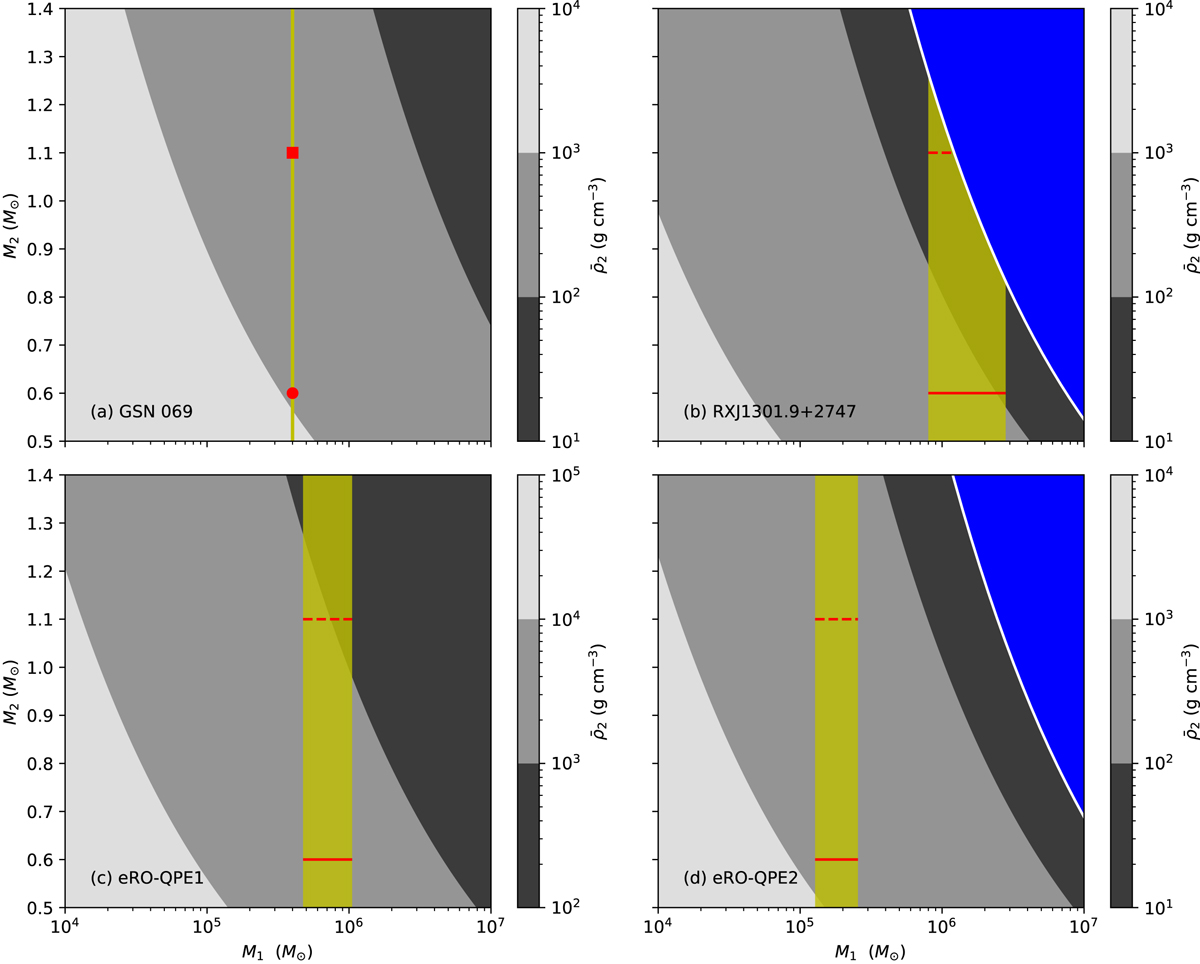
Fig. 3.
Download original image
Contours of allowed average density for different values of the SMBH mass, M1, and the companion star mass, M2. The white solid lines refer to constraints from the rise time. The excluded region is shown in blue. The gray region shows different densities of the companion star. The yellow vertical solid line (for panel a) and shading regions (for panel b–d) represent the mass of SMBHs. The allowed parameter space is shown in yellow. For GSN 069, the star with mass of 0.6 M⊙ and 1.1 M⊙ are shown in red circle and square in panel a, respectively. For the other three shown in panel b–d, the stars with a mass of 0.6 M⊙ and 1.1 M⊙ are shown in red solid and dashed lines, respectively. The average density of stars to explain the properties of QPEs is listed in Table 2, which is between 52.34 g cm−3 and 3642.22 g cm−3. Only low- and intermediate-mass stars whose H envelopes are lost in the VLTP phase (Herwig et al. 1999) can fulfill these requirements. The mass of hydrogen-deficient post-AGB stars are almost the same as the final stellar evolution product WDs, but the density is lower because the existence of He envelopes.
Current usage metrics show cumulative count of Article Views (full-text article views including HTML views, PDF and ePub downloads, according to the available data) and Abstracts Views on Vision4Press platform.
Data correspond to usage on the plateform after 2015. The current usage metrics is available 48-96 hours after online publication and is updated daily on week days.
Initial download of the metrics may take a while.