Fig. 1
Download original image
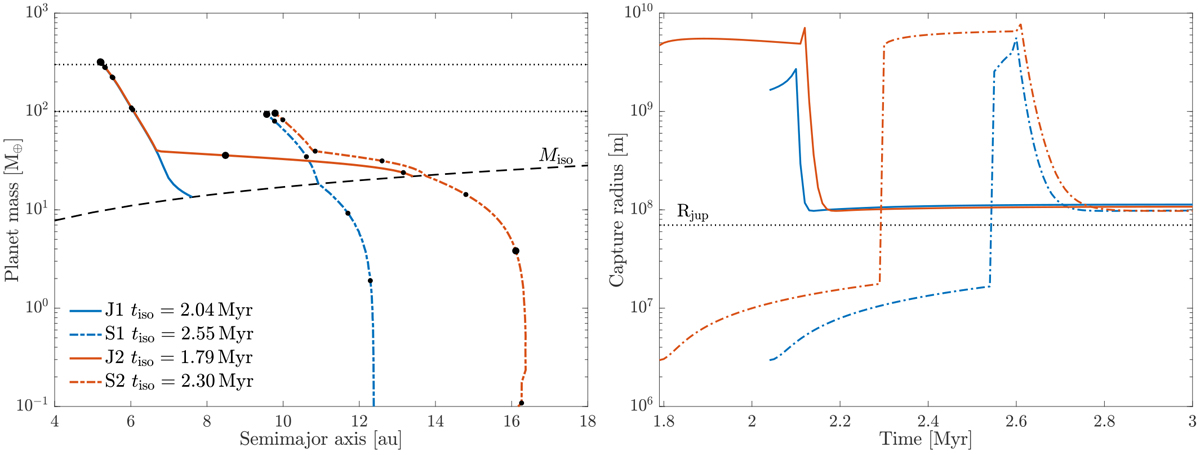
Planetary growth tracks and evolution of the capture radii. Left: planet mass versus semimajor axis evolution for Jupiter (J) and Saturn (S) in gas accretion scheme 1 and 2. Large dots indicate a time of 2 and 3 Myr, and small dots are separated by 0.2 Myr. We started the simulation at the time when Jupiter reached the pebble isolation mass (tiso), and further included the growth and migration of Saturn’s core. In scheme 1 the contraction of the envelope occurs on a short timescale, resulting in fast gap opening and little migration. In scheme 2 this phase is significantly longer, and thus the planets migrate a further distance before coming to a halt due to gap opening. Right: capture radius versus time for the growth tracks presented in the left panel, calculated using a planetesimal radius of 100 km. The approximation for the capture radius has three regimes: before gas accretion is initiated, the capture radius is equal to the core radius; during the first phase of gas accretion, the envelope is enhanced, resulting in a large capture radius; and after the onset of runaway gas accretion, the capture radius decreases by roughly two orders of magnitude, and it takes on a value of about 1.5 times the current Jupiter radius.
Current usage metrics show cumulative count of Article Views (full-text article views including HTML views, PDF and ePub downloads, according to the available data) and Abstracts Views on Vision4Press platform.
Data correspond to usage on the plateform after 2015. The current usage metrics is available 48-96 hours after online publication and is updated daily on week days.
Initial download of the metrics may take a while.