Fig. 2
Download original image
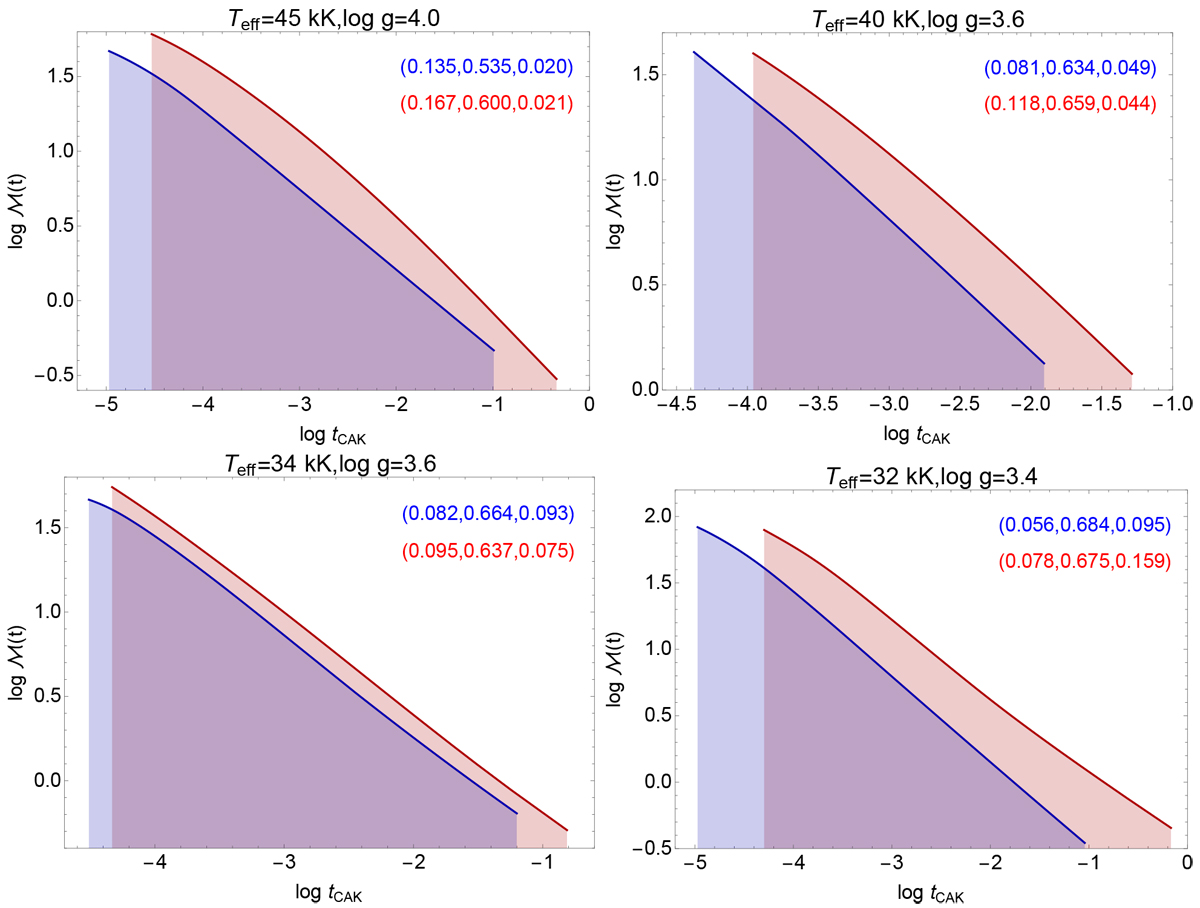
Comparison of self-consistent fitting of the force multiplier M(t) between the implementation of the temperature structure (blue) and the fixed temperature (red). Calculated line-force parameters (k, α, δ) are displayed in the same colour code. The shaded area represents the t optical depth range where the force multiplier is defined within, from the sonic point outwards.
Current usage metrics show cumulative count of Article Views (full-text article views including HTML views, PDF and ePub downloads, according to the available data) and Abstracts Views on Vision4Press platform.
Data correspond to usage on the plateform after 2015. The current usage metrics is available 48-96 hours after online publication and is updated daily on week days.
Initial download of the metrics may take a while.