Fig. 9.
Download original image
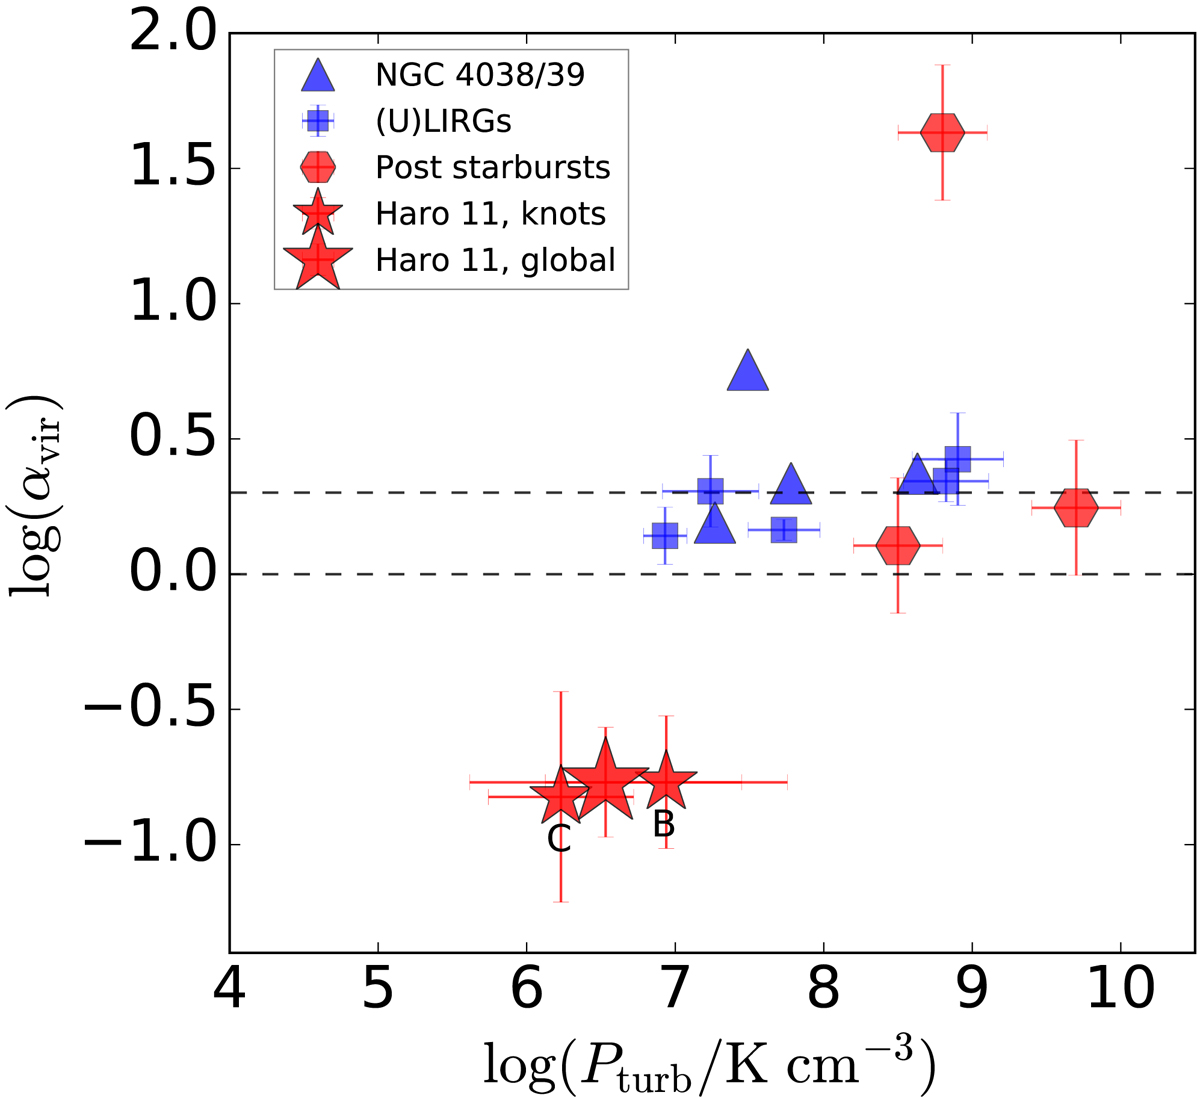
Comparison of the turbulent pressure (Pturb) and the viral parameter (αvir) between Haro 11 and other types of galaxies. The properties of knots B, C, and Haro 11 are shown as red stars. Blue squares represent the global properties of five (U)LIRGs calculated from the pixel-binned measurements of Wilson et al. (2019). The global properties of three post-starburst galaxies derived by Smercina et al. (2022) are shown as red hexagons. Blue triangles represent the four massive, young cluster-forming regions located at the overlap region of NGC 4038/4039 (Tsuge et al. 2021). The error bars cover the 16–84% widths of the distribution of Pturb and αvir across all resolved regions in each galaxy. Dashed lines represent the levels of αvir = 1, 2, respectively.
Current usage metrics show cumulative count of Article Views (full-text article views including HTML views, PDF and ePub downloads, according to the available data) and Abstracts Views on Vision4Press platform.
Data correspond to usage on the plateform after 2015. The current usage metrics is available 48-96 hours after online publication and is updated daily on week days.
Initial download of the metrics may take a while.