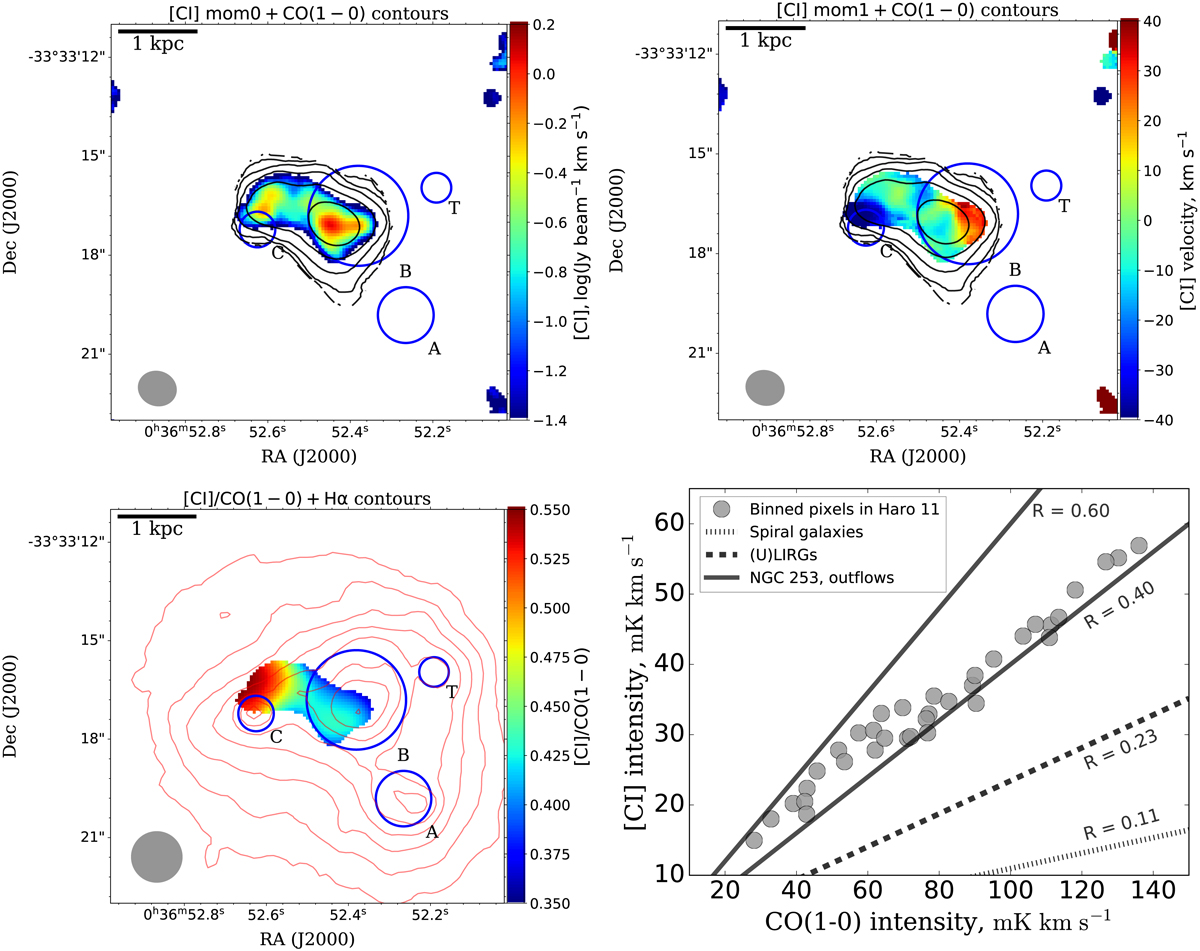
Fig. 8.
Download original image
[C I] emission distribution in Haro 11. Upper: distribution of [C I](1–0) emission (color) intensity (left) and velocity (right) contoured with the CO(1–0) emission (black contours), with levels of (1/2)n (n = 1, 2, …, 8) times of the maximum value of CO intensities. Bottom-left: distribution of the line ratio (R = 1[C I]/ICO(1−0)) of the [CI] and CO emission intensity. Other symbols are the same as in Fig. 1. Bottom-right: integrated intensity of [C I] pixels versus CO(1–0), in units of mK km s−1. The pixels in Haro 11 are rebinned as ∼0.4″. The average ratios in the disks of spiral galaxies and in (U)LIRGs reported by Jiao et al. (2019) are shown as dotted (R ∼ 0.11) and dashed (R ∼ 0.23) lines, respectively. Black solid lines represent the ratios (R ∼ 0.4–0.6) in the outflow regions that emerge from the nucleus of NGC 253 (Krips et al. 2016).
Current usage metrics show cumulative count of Article Views (full-text article views including HTML views, PDF and ePub downloads, according to the available data) and Abstracts Views on Vision4Press platform.
Data correspond to usage on the plateform after 2015. The current usage metrics is available 48-96 hours after online publication and is updated daily on week days.
Initial download of the metrics may take a while.