Fig. 7.
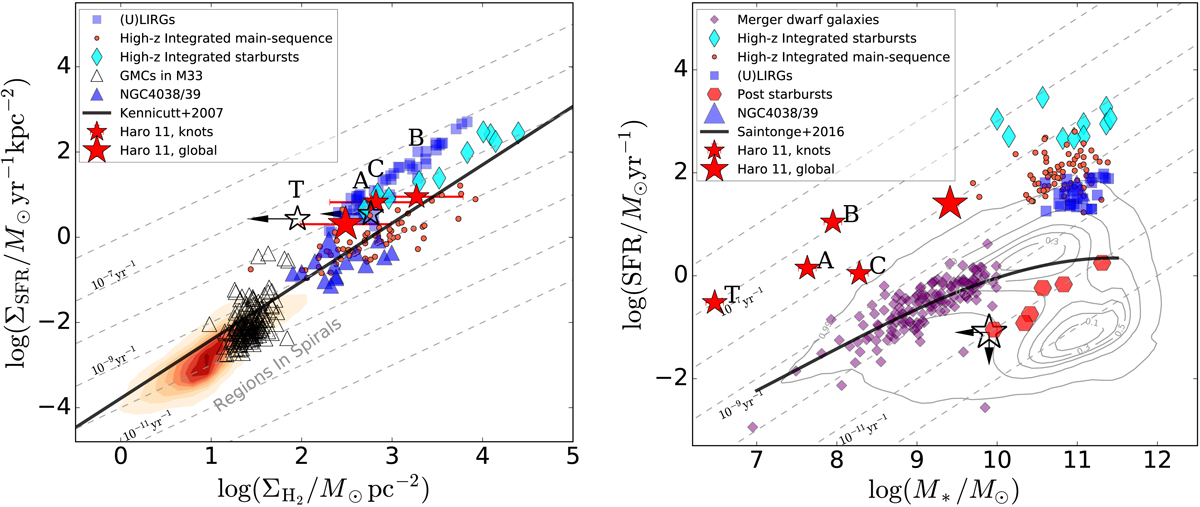
Download original image
Scaling relations of Haro 11 and other galaxies. Left: Kennicutt–Schmidt law, gas surface density ΣH2 vs. SFR surface density ΣSFR, for different galaxy samples. Red stars mark the knots in Haro 11, and a larger red star shows the global value. Because of the lack of CO detection at knots A and T, the upper limited ΣH2 are shown as white stars. The star-forming clumps in the nearby merger Antennae (NGC 4038/4039) galaxy are marked as blue triangles (Tsuge et al. 2021), the global value is shown as the larger blue triangle (Gao et al. 2001; Lahén et al. 2018). The spatially resolved properties in nearby (U)LIRGs from Wilson et al. (2019) are marked as blue squares. Other samples are collected from Shi et al. (2018), including local spiral galaxies (red contours, Bigiel et al. 2008; Shi et al. 2011), giant molecular clouds in M33 (white triangles, Gratier et al. 2010), high-z main sequence galaxies (red circles: z ∼ 1.2–2.2, Tacconi et al. 2013), and starburst galaxies (cyan diamonds: 1.2 < z < 6.3, see the references in Shi et al. 2018). The black line represents the K–S law derived by Kennicutt et al. (2007). The gray dashed lines represent different SFE levels. Right: main sequence relation, stellar mass M* vs. SFR, for different galaxy samples. Global properties of massive merger (U)LIRGs from Shangguan et al. (2019) are shown as blue squares. Post starburst galaxies from Smercina et al. (2018, 2022) are represented with hexagons, in which SFRs are derived from Hα luminosities. The purple diamonds represent the merging dwarf galaxies in the local Universe (Paudel et al. 2018), in which the SFRs are estimated with the FUV fluxes from GALEX all-sky survey. Gray contours indicate all of the galaxies derived from the SDSS DR8 MPA-JHU catalog. The main sequence relation of SFGs in the local Universe is shown as a solid black line (Saintonge et al. 2016). The gray dashed lines represent different sSFR levels. The white star indicates the post-starburst phase of Haro 11 in the future, where arrows represent the upper limit values of stellar mass and SFR. Other symbols are the same as in the left panel.
Current usage metrics show cumulative count of Article Views (full-text article views including HTML views, PDF and ePub downloads, according to the available data) and Abstracts Views on Vision4Press platform.
Data correspond to usage on the plateform after 2015. The current usage metrics is available 48-96 hours after online publication and is updated daily on week days.
Initial download of the metrics may take a while.