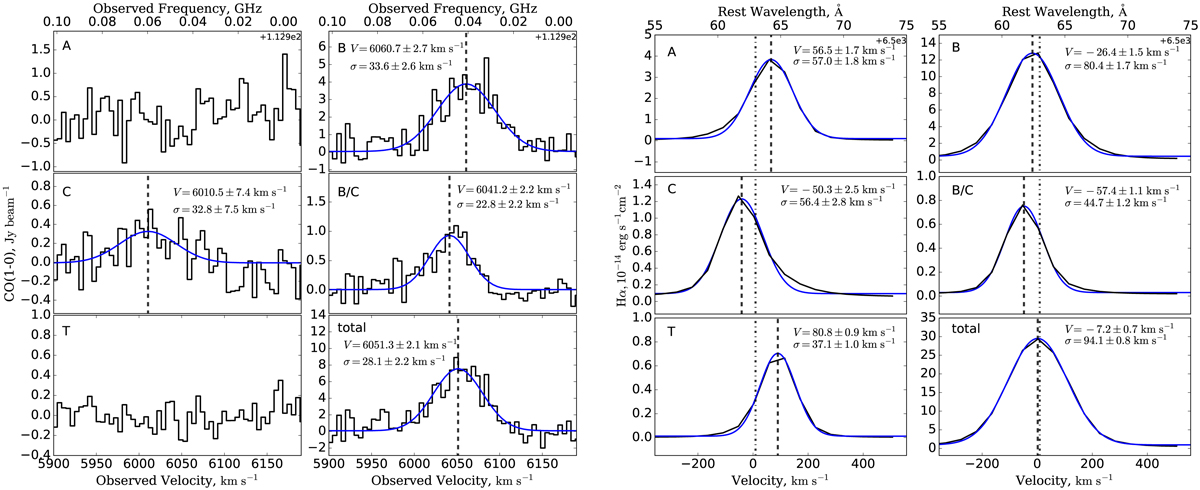
Fig. 3.
Download original image
Spectra of CO(1–0) and Hα emission in Haro 11. Left: CO(1–0) spectra collected from the knots (A, B, C, T), the region (r ∼ 0.6″, marked as B/C) between B and C, and the entire CO region. Right: Hα spectra collected from the knots (A, B, C, T), the region between B and C marked B/C, and the R80 region. The dash-dotted lines show the rest-frame wavelength of the Hα emission line. In each panel, blue lines represent the best one-Gaussian fitting spectra, attached with the relevant results, for example, the velocity of CO and systemic velocity subtracted velocity of Hα. The velocity dispersion σ values are derived from the Gaussian widths by subtracting the instrument resolution. Dashed lines represent the fitting velocity of CO and Hα.
Current usage metrics show cumulative count of Article Views (full-text article views including HTML views, PDF and ePub downloads, according to the available data) and Abstracts Views on Vision4Press platform.
Data correspond to usage on the plateform after 2015. The current usage metrics is available 48-96 hours after online publication and is updated daily on week days.
Initial download of the metrics may take a while.