Fig. 2.
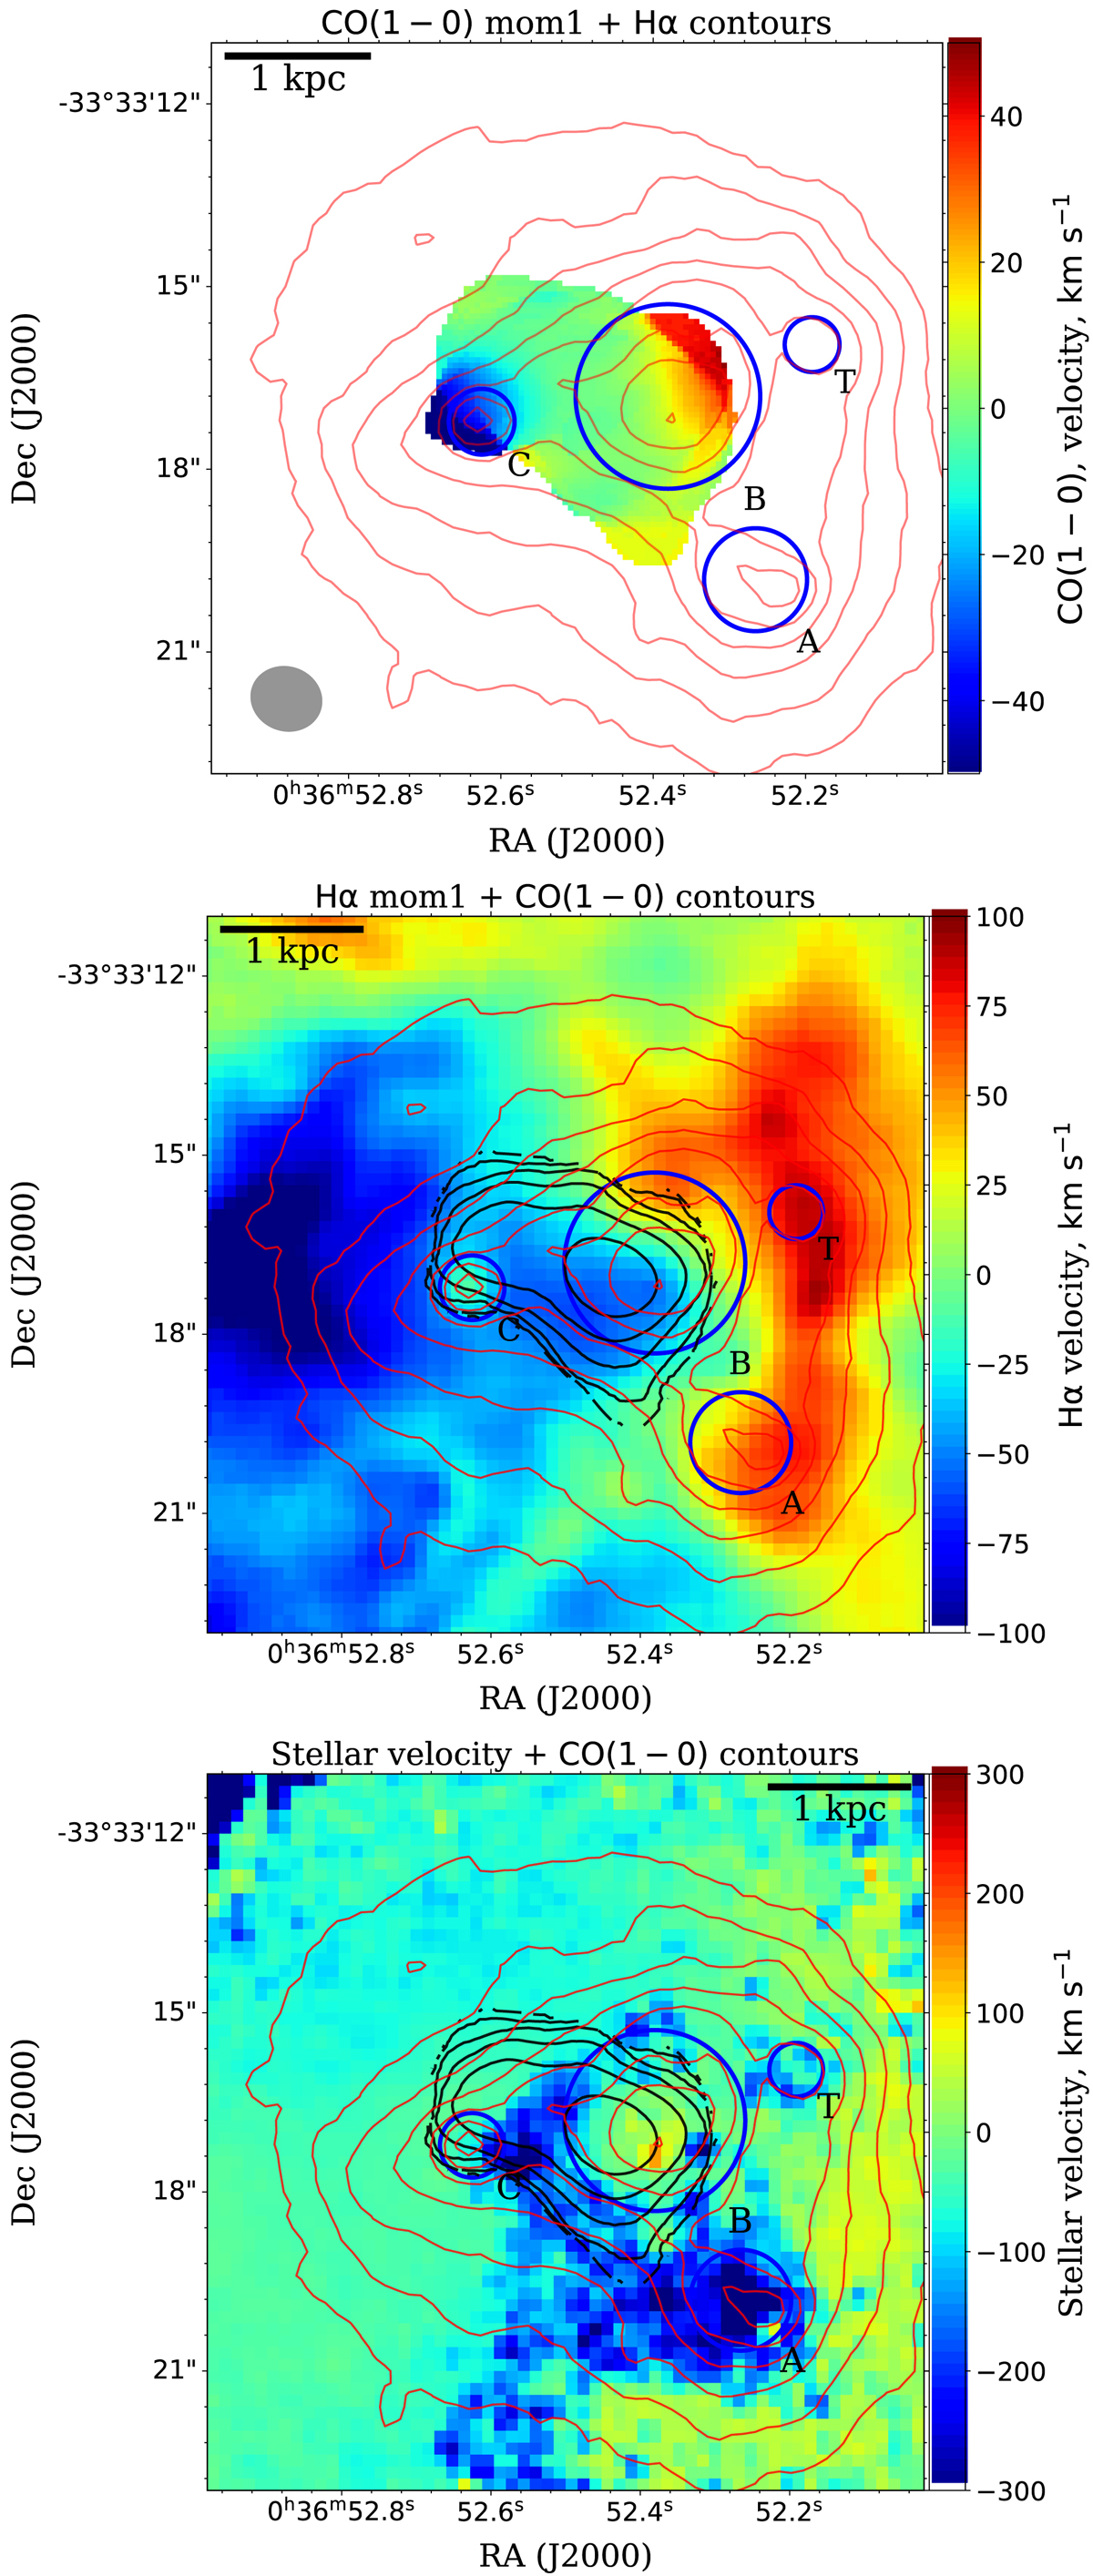
Download original image
Velocity distribution of molecular and ionized gas, as well as the stellar components, in Haro 11. Top: Systemic-velocity-subtracted intensity-weighted velocity field (moment 1, 4 × rms) of CO(1–0) emission line. Middle: systemic velocity-subtracted intensity-weighted velocity field of Hα emission. Bottom: Stellar velocity map derived from the SSP fitting results. Black contours and red contours represent the intensities of CO(1–0) and Hα emission lines, respectively.
Current usage metrics show cumulative count of Article Views (full-text article views including HTML views, PDF and ePub downloads, according to the available data) and Abstracts Views on Vision4Press platform.
Data correspond to usage on the plateform after 2015. The current usage metrics is available 48-96 hours after online publication and is updated daily on week days.
Initial download of the metrics may take a while.