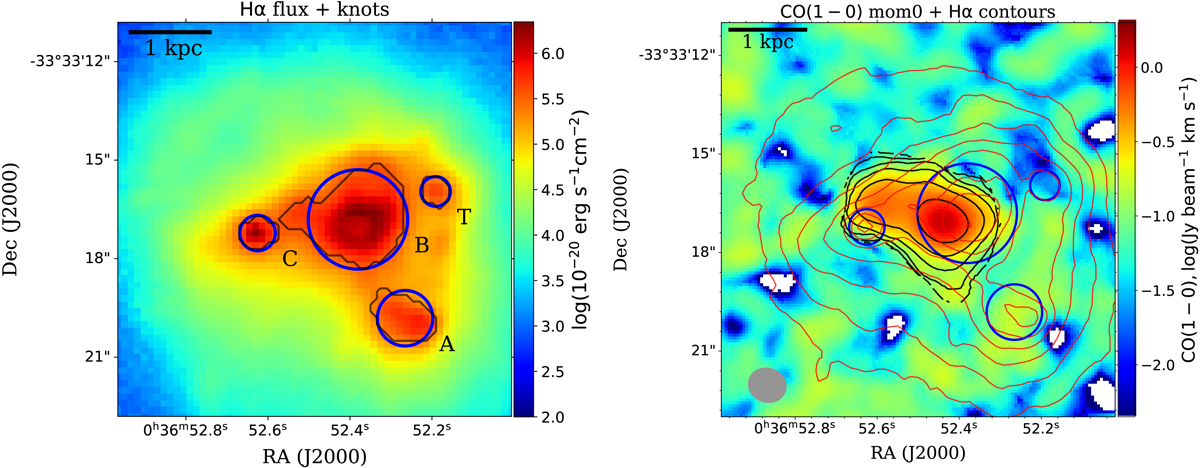
Fig. 1.
Download original image
Emission distribution of ionized and molecular gas in Haro 11. Left integrated intensity map of attenuation-corrected Hα emission. The gray contours represent the identified star formation knots by Astrodendro, and the blue circles show the same area size. Right integrated intensity (moment 0) of the CO(1–0) emission line without threshold setting. The black contours represent the integrated intensity of CO(1–0) with a 4 × rms threshold. The Hα intensity is marked by red contours, with levels of (1/2)n (n = 1, 2, …, 8) times the maximum value of Hα intensity. The CO(1–0) beam size is shown as a solid gray elliptical circle in the bottom left.
Current usage metrics show cumulative count of Article Views (full-text article views including HTML views, PDF and ePub downloads, according to the available data) and Abstracts Views on Vision4Press platform.
Data correspond to usage on the plateform after 2015. The current usage metrics is available 48-96 hours after online publication and is updated daily on week days.
Initial download of the metrics may take a while.