Free Access
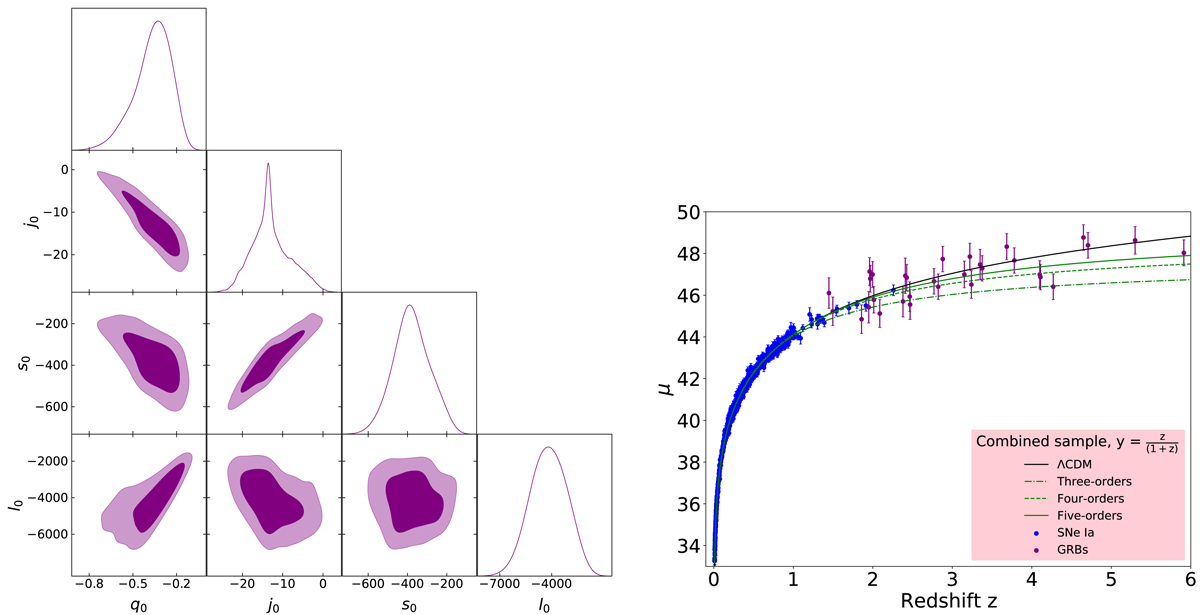
Fig. 8.
Download original image
Comparison between different expansion orders using the y-redshift method. Right panel: confidence contours (1σ and 2σ) for the parameters space (q0, j0, s0, and l0) from the combined sample. Blue points are SNe Ia from the Pantheon sample. Purple points are 31 LGRBs constructed by Wang et al. (2022).
Current usage metrics show cumulative count of Article Views (full-text article views including HTML views, PDF and ePub downloads, according to the available data) and Abstracts Views on Vision4Press platform.
Data correspond to usage on the plateform after 2015. The current usage metrics is available 48-96 hours after online publication and is updated daily on week days.
Initial download of the metrics may take a while.