Free Access
Fig. 5.
Download original image
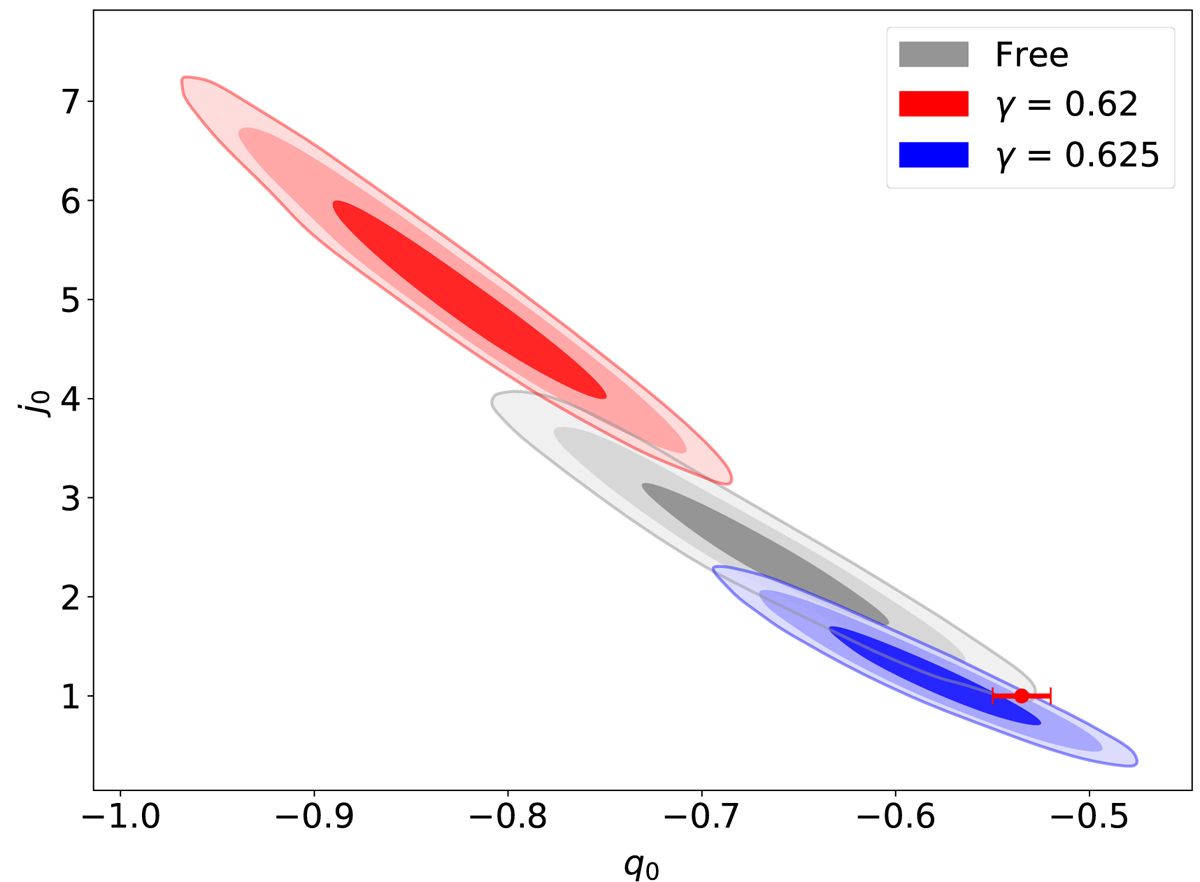
Confidence contours (1σ, 2σ, and 3σ) for the parameters space (q0 and j0) from the SN-Q sample utilizing the Padé(2,1) method. The red point represents (−0.54, 1) the value given by the Planck 2018 results (Planck Collaboration VII 2020).
Current usage metrics show cumulative count of Article Views (full-text article views including HTML views, PDF and ePub downloads, according to the available data) and Abstracts Views on Vision4Press platform.
Data correspond to usage on the plateform after 2015. The current usage metrics is available 48-96 hours after online publication and is updated daily on week days.
Initial download of the metrics may take a while.