Fig. 1.
Download original image
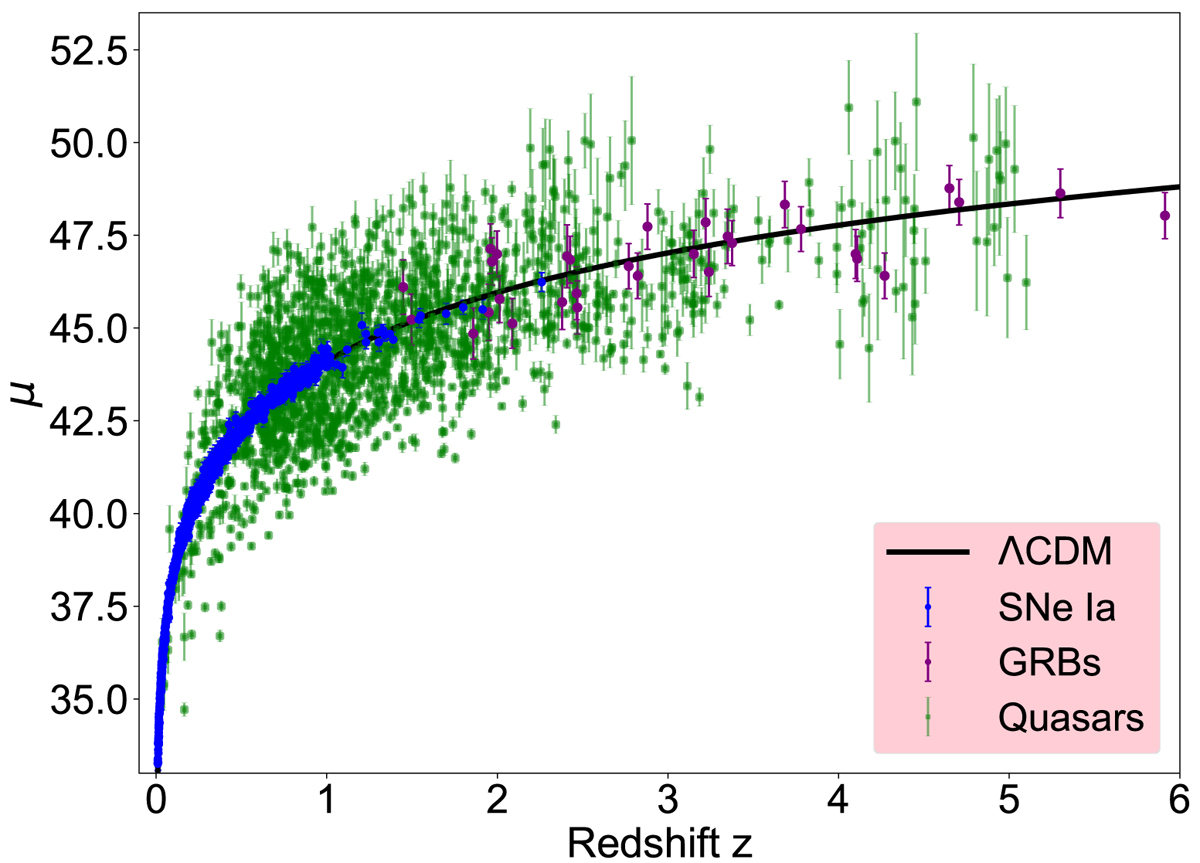
Hubble diagram of SNe Ia, GRBs, and quasars. The picture includes 1048 SNe Ia of the Pantheon sample, 31 LGRBs, and 1598 quasars. The black solid line is a flat ΛCDM model with Ωm = 0.3 and Hubble constant H0 = 70 km s−1 Mpc−1. Distance moduli and corresponding errors are provided by Risaliti & Lusso (2019) which were calculated by the calibrated UV and X-ray correlation using the low-redshift SNe Ia.
Current usage metrics show cumulative count of Article Views (full-text article views including HTML views, PDF and ePub downloads, according to the available data) and Abstracts Views on Vision4Press platform.
Data correspond to usage on the plateform after 2015. The current usage metrics is available 48-96 hours after online publication and is updated daily on week days.
Initial download of the metrics may take a while.