Fig. 4
Download original image
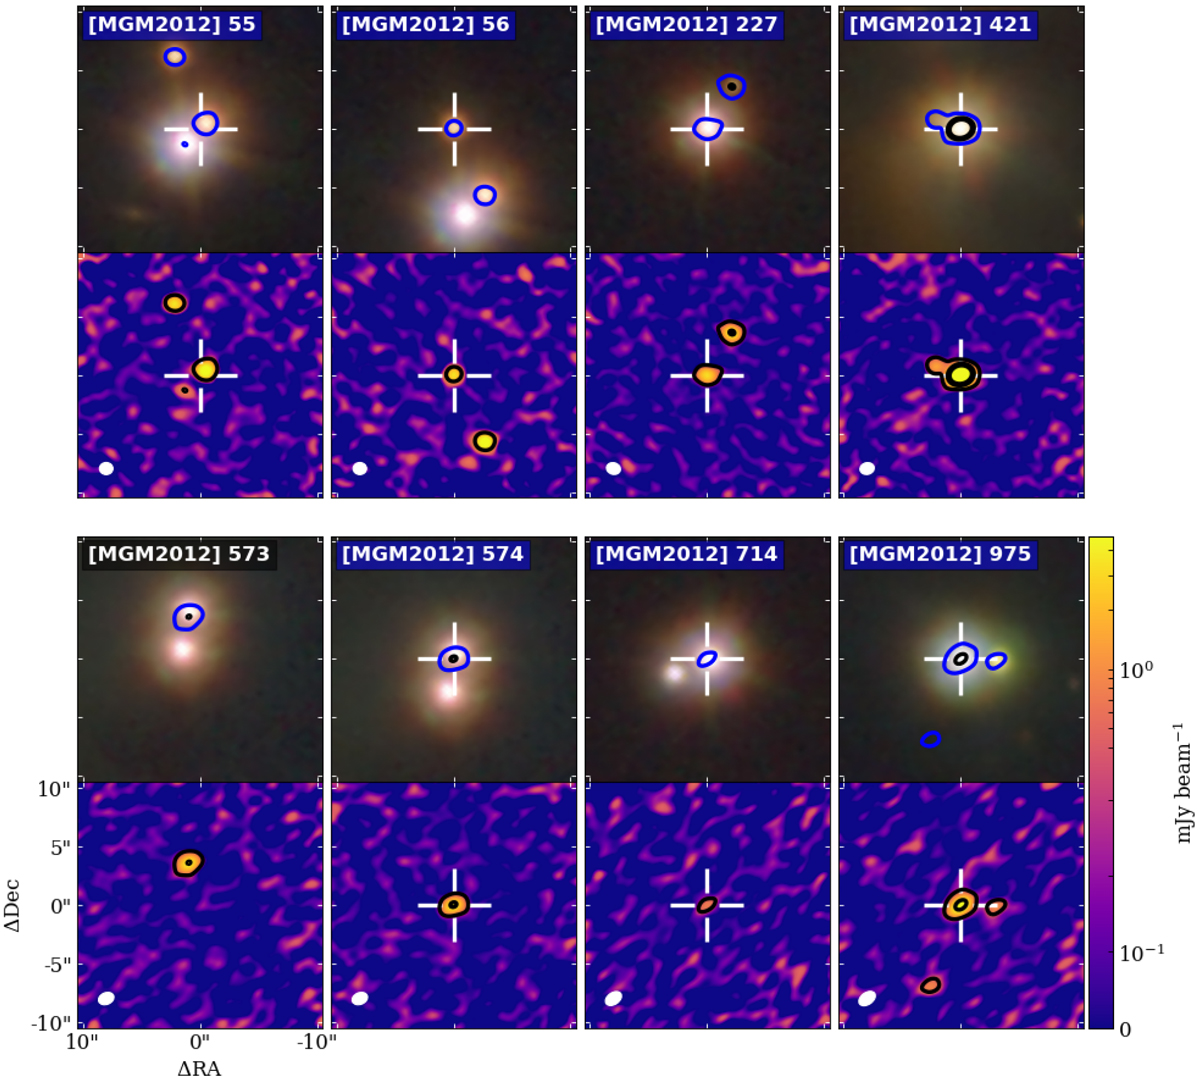
Images of selected (candidate) multiple systems. For each source, the top panel shows NIR data (J, H, and Ks-band) form the VISION survey (Meingast et al. 2016) in colors, and 5, 50, and 100σ contour levels. The bottom panel shows the ALMA image at 225 GHz only. White crosshairs mark the source positions of detected sources. Nondetections are marked with grayed-out names. The beam is shown in white in the ALMA images, in the lower left.
Current usage metrics show cumulative count of Article Views (full-text article views including HTML views, PDF and ePub downloads, according to the available data) and Abstracts Views on Vision4Press platform.
Data correspond to usage on the plateform after 2015. The current usage metrics is available 48-96 hours after online publication and is updated daily on week days.
Initial download of the metrics may take a while.