Fig. 12
Download original image
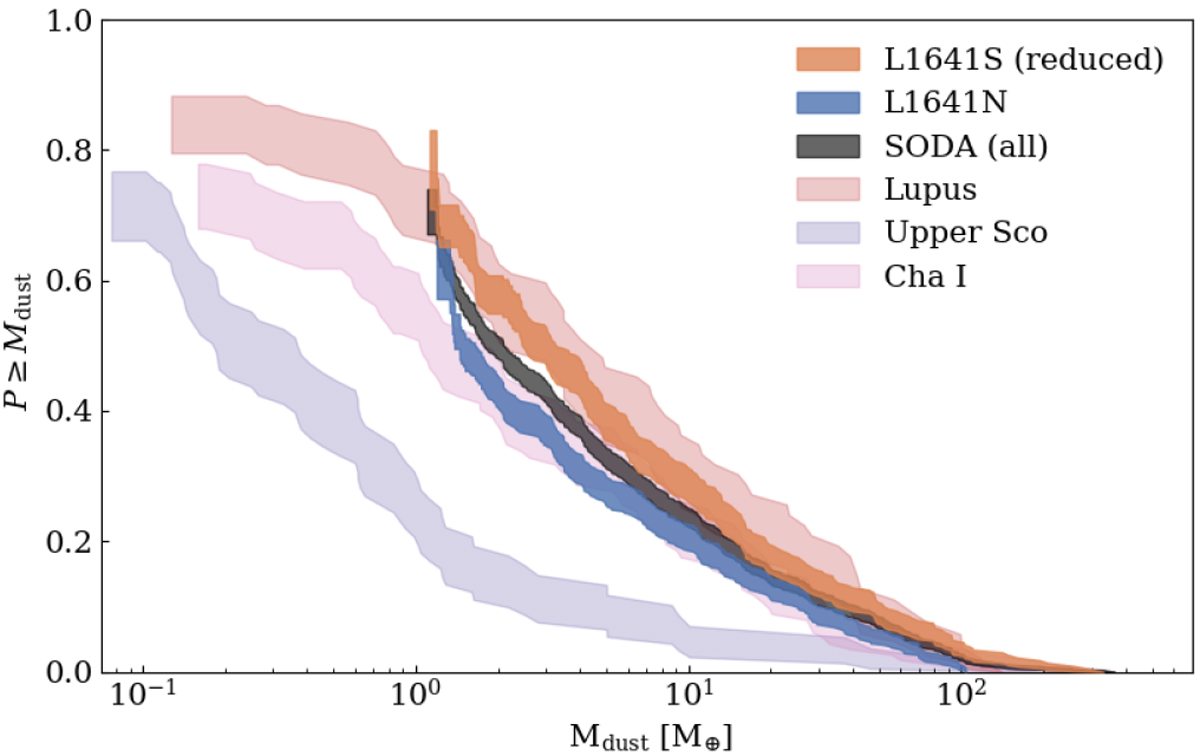
Comparison of the SODA results to three nearby SFRs. Kaplan–Meier estimators for the cumulative disk mass distribution in L1641S (reduced) (orange), L1641N (blue), the full SODA sample (gray), and three literature regions: Lupus (tan), Cha I (pink), and Upper Sco (purple) (Ansdell et al. 2016; Pascucci et al. 2016; Barenfeld et al. 2016).
Current usage metrics show cumulative count of Article Views (full-text article views including HTML views, PDF and ePub downloads, according to the available data) and Abstracts Views on Vision4Press platform.
Data correspond to usage on the plateform after 2015. The current usage metrics is available 48-96 hours after online publication and is updated daily on week days.
Initial download of the metrics may take a while.