Fig. 9
Download original image
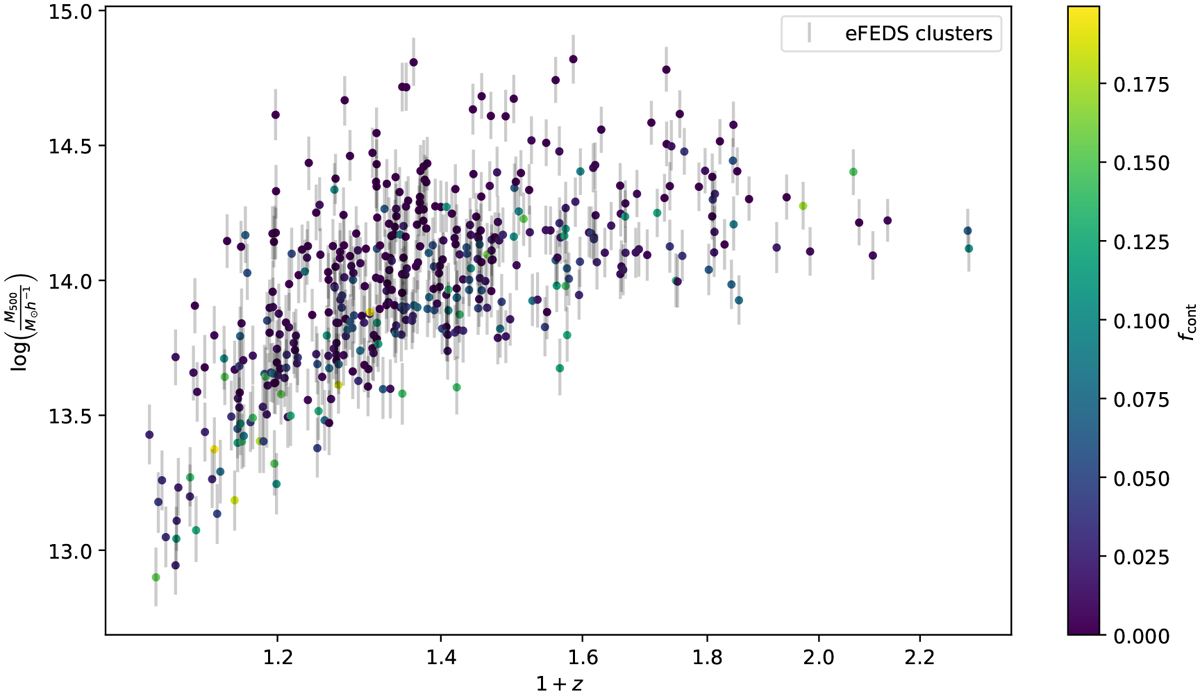
Cluster mass M500 and redshift z of each cluster color coded by the quantity fcont. The mass is randomly sampled from the posterior of M500 as an ensemble mass (see Eq. (66)).
Current usage metrics show cumulative count of Article Views (full-text article views including HTML views, PDF and ePub downloads, according to the available data) and Abstracts Views on Vision4Press platform.
Data correspond to usage on the plateform after 2015. The current usage metrics is available 48-96 hours after online publication and is updated daily on week days.
Initial download of the metrics may take a while.