Fig. 8
Download original image
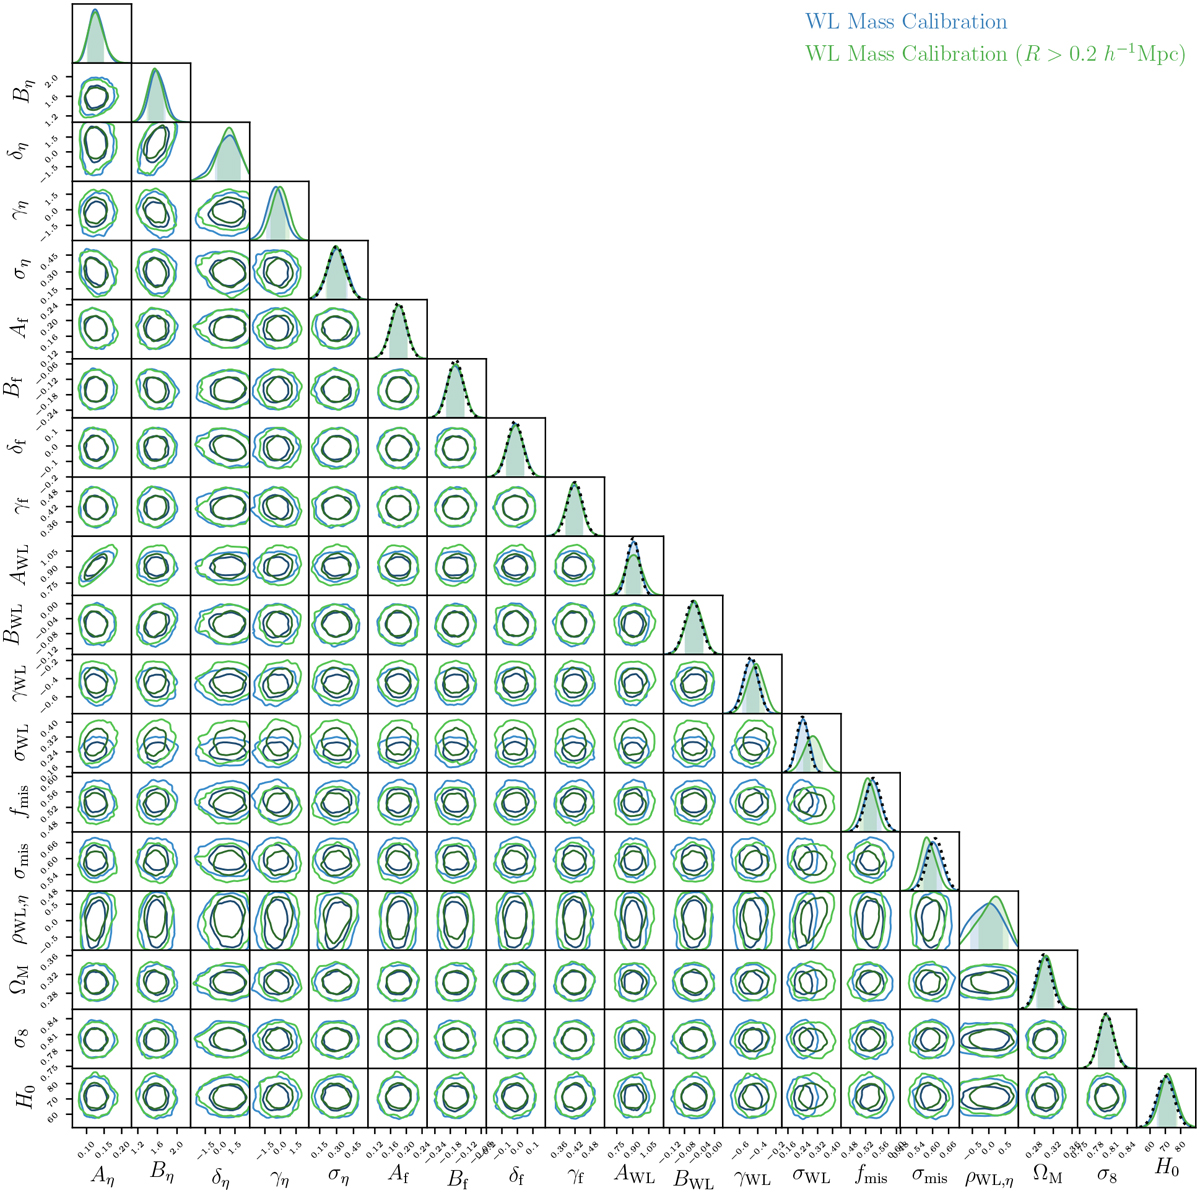
Parameter constraints in the joint modeling of X-ray count rates and weak-lensing shear profiles. The results from the modeling of shear profiles at R > 0.2h−1Mpc and R > 0.5h−1Mpc are shown in green and blue, respectively. The marginalized posteriors of the parameters are presented in the diagonal subplots, where the priors are indicated by the dotted lines. The off-diagonal subplots contain the correlations between the parameters. The contours display the 1σ and 2σ confidence levels. We only show the priors in the case of fitting shear profiles at R > 0.5h−1Mpc, for clarity. As seen, there is no clear evidence of a difference in the results between the modeling of shear profiles at R > 0.2h−1Mpc and R > 0.5h−1Mpc.
Current usage metrics show cumulative count of Article Views (full-text article views including HTML views, PDF and ePub downloads, according to the available data) and Abstracts Views on Vision4Press platform.
Data correspond to usage on the plateform after 2015. The current usage metrics is available 48-96 hours after online publication and is updated daily on week days.
Initial download of the metrics may take a while.