Fig. 6
Download original image
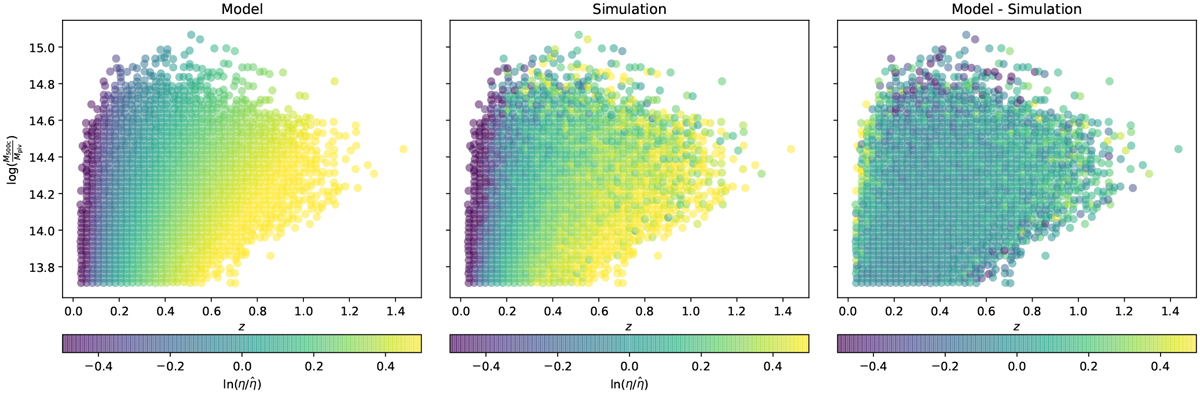
Bias bηη, which is defined as the ratio of the observed count rate η to the true count rate ![]() , from the simulation and the best-fit model (middle and left panels, respectively). These are presented as a function of true cluster mass M500 at each redshift, color coded according to In (bη). A clear gradient depending on both mass and redshift is seen. The best-fit model, as described in Eq. (40), provides a good description of the simulation, as suggested by their difference as shown in the right panel.
, from the simulation and the best-fit model (middle and left panels, respectively). These are presented as a function of true cluster mass M500 at each redshift, color coded according to In (bη). A clear gradient depending on both mass and redshift is seen. The best-fit model, as described in Eq. (40), provides a good description of the simulation, as suggested by their difference as shown in the right panel.
Current usage metrics show cumulative count of Article Views (full-text article views including HTML views, PDF and ePub downloads, according to the available data) and Abstracts Views on Vision4Press platform.
Data correspond to usage on the plateform after 2015. The current usage metrics is available 48-96 hours after online publication and is updated daily on week days.
Initial download of the metrics may take a while.