Fig. 5
Download original image
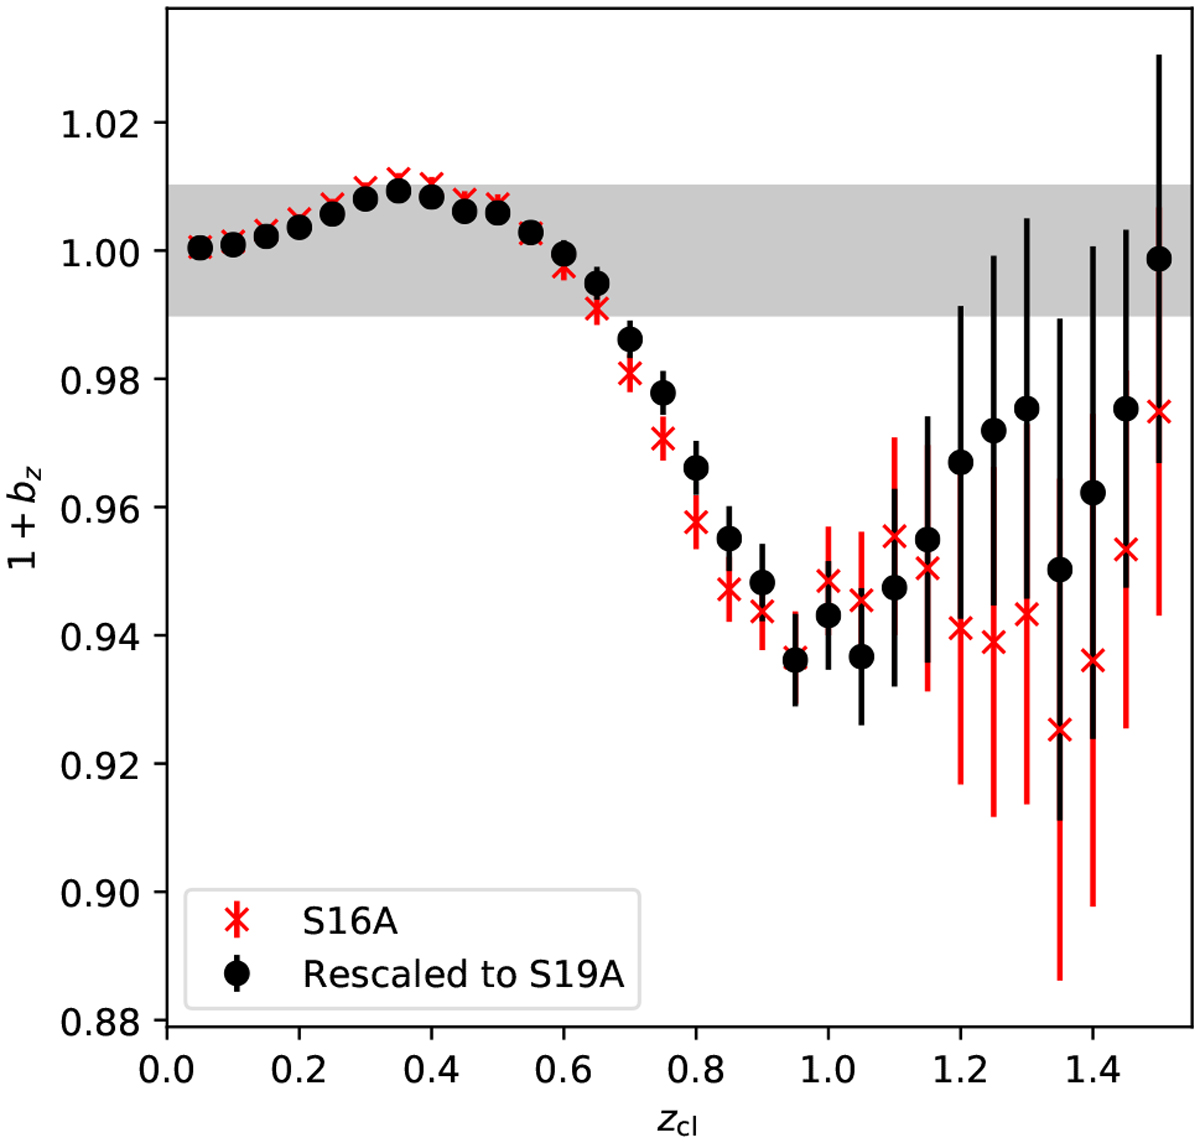
Photo-z bias bz (zcl) as a function of cluster redshift zcl. The result derived from the first-year HSC data is shown by the red crosses, which are re-scaled to the three-year HSC data shown by the black points based on the difference in the photo-z between the data sets (see Sect. 3.8). We also show a reference at the level of 1% by the gray shaded region. The resulting bz(zcl) is applied to the calibration of weak-lensing mass bias for eFEDS clusters (see Sect. 4.2).
Current usage metrics show cumulative count of Article Views (full-text article views including HTML views, PDF and ePub downloads, according to the available data) and Abstracts Views on Vision4Press platform.
Data correspond to usage on the plateform after 2015. The current usage metrics is available 48-96 hours after online publication and is updated daily on week days.
Initial download of the metrics may take a while.