Fig. 4
Download original image
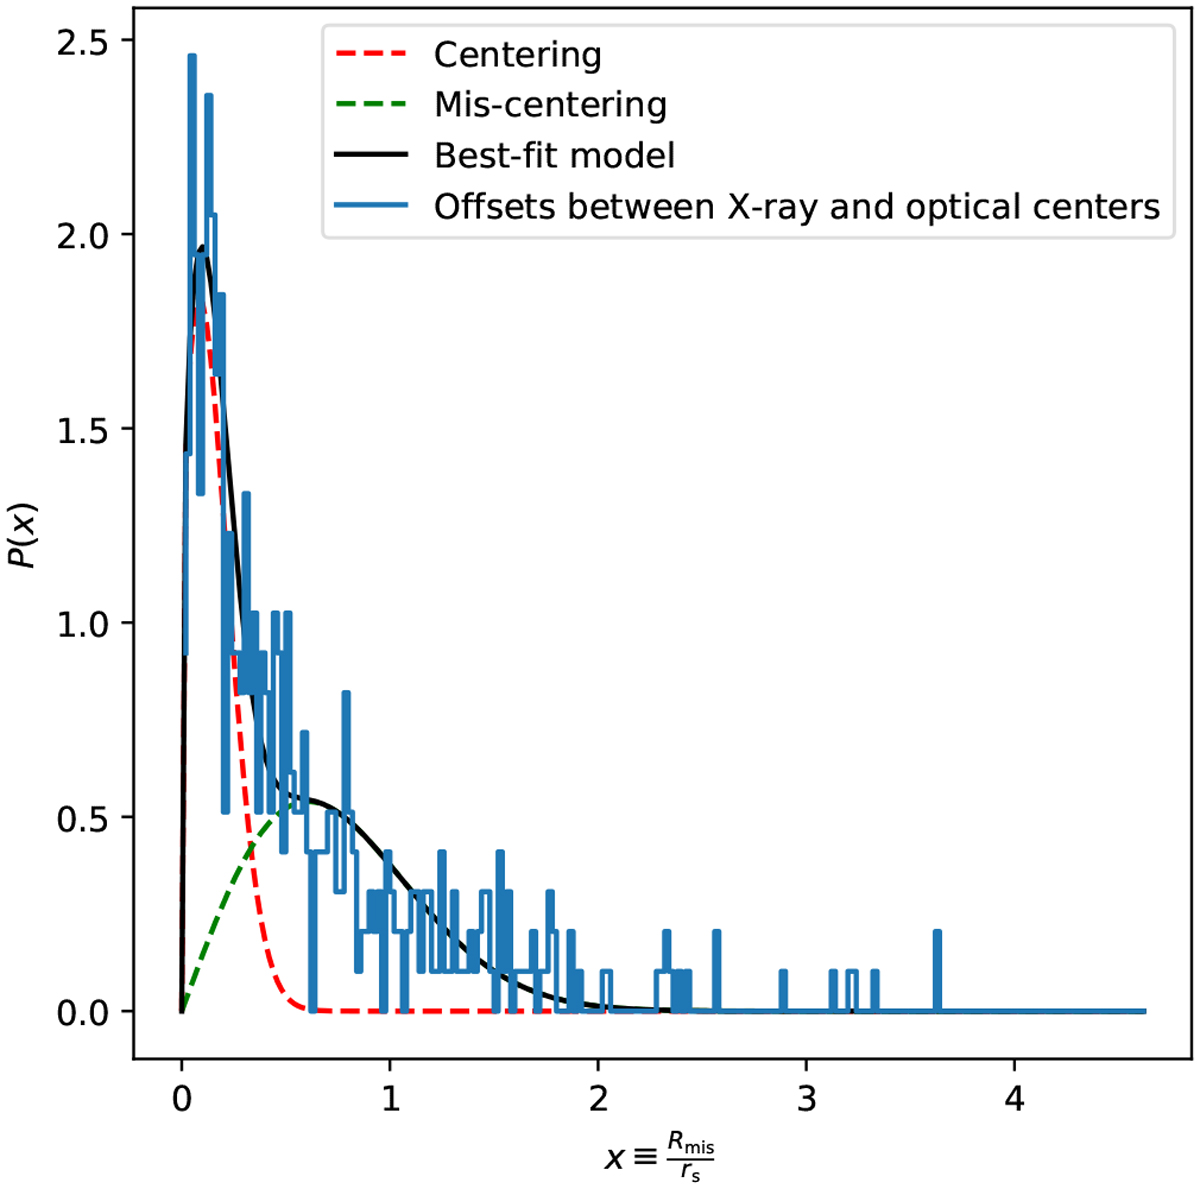
Distribution of offsets between the X-ray and optically defined centers of eFEDS clusters. The blue histogram is the observed offset distribution in the unit of the scale radius. The black solid line represents the best-fit model, i.e., Eq. (20), which consists of centering and mis-centering components, as indicated by the red and green dashed lines, respectively.
Current usage metrics show cumulative count of Article Views (full-text article views including HTML views, PDF and ePub downloads, according to the available data) and Abstracts Views on Vision4Press platform.
Data correspond to usage on the plateform after 2015. The current usage metrics is available 48-96 hours after online publication and is updated daily on week days.
Initial download of the metrics may take a while.