Fig. 3
Download original image
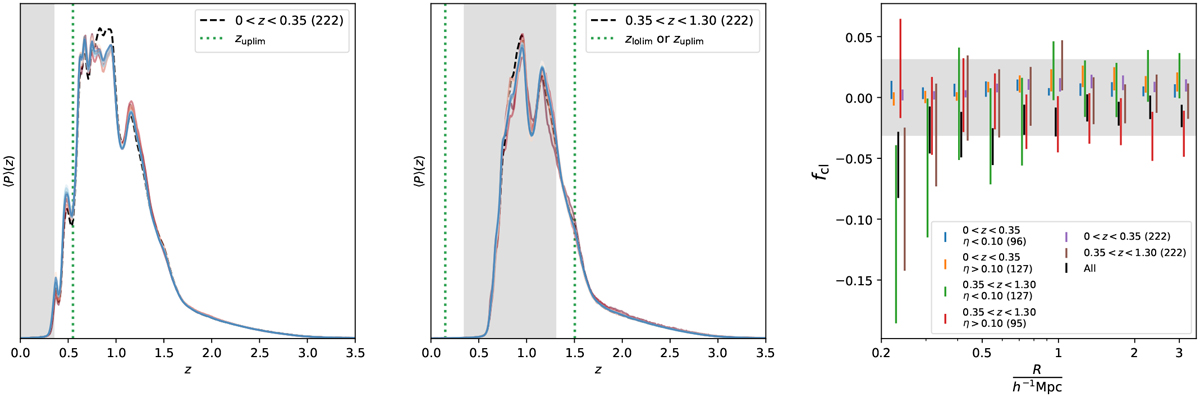
Comparison of the redshift distributions between cluster and random fields at low (left panel) and high (middle panel) redshifts. In the left and middle panels, the color scheme ranging from dark red to blue indicates the scale of the clustercentric radius from the core to large radii, while the black dashed lines are the redshift distributions of random fields. Meanwhile, the vertical gray regions indicate the redshift range of the cluster samples, while the upper and lower limits (zlolim and zuplim) of the redshift interval in Eq. (17) are shown by green dotted lines. In the right panel, the profiles of cluster contamination in each subsample are shown with the color scheme according to the sample binning. The resulting profile of the total sample is in black. The horizontal gray region indicates the conservative estimate of cluster contamination at a level of ≤3% (1σ), which is used to calibrate the weak-lensing mass bias (see Sect. 4.2). In these three panels, the numbers in the parentheses indicate the total numbers of the clusters used in the binning.
Current usage metrics show cumulative count of Article Views (full-text article views including HTML views, PDF and ePub downloads, according to the available data) and Abstracts Views on Vision4Press platform.
Data correspond to usage on the plateform after 2015. The current usage metrics is available 48-96 hours after online publication and is updated daily on week days.
Initial download of the metrics may take a while.