Fig. 2
Download original image
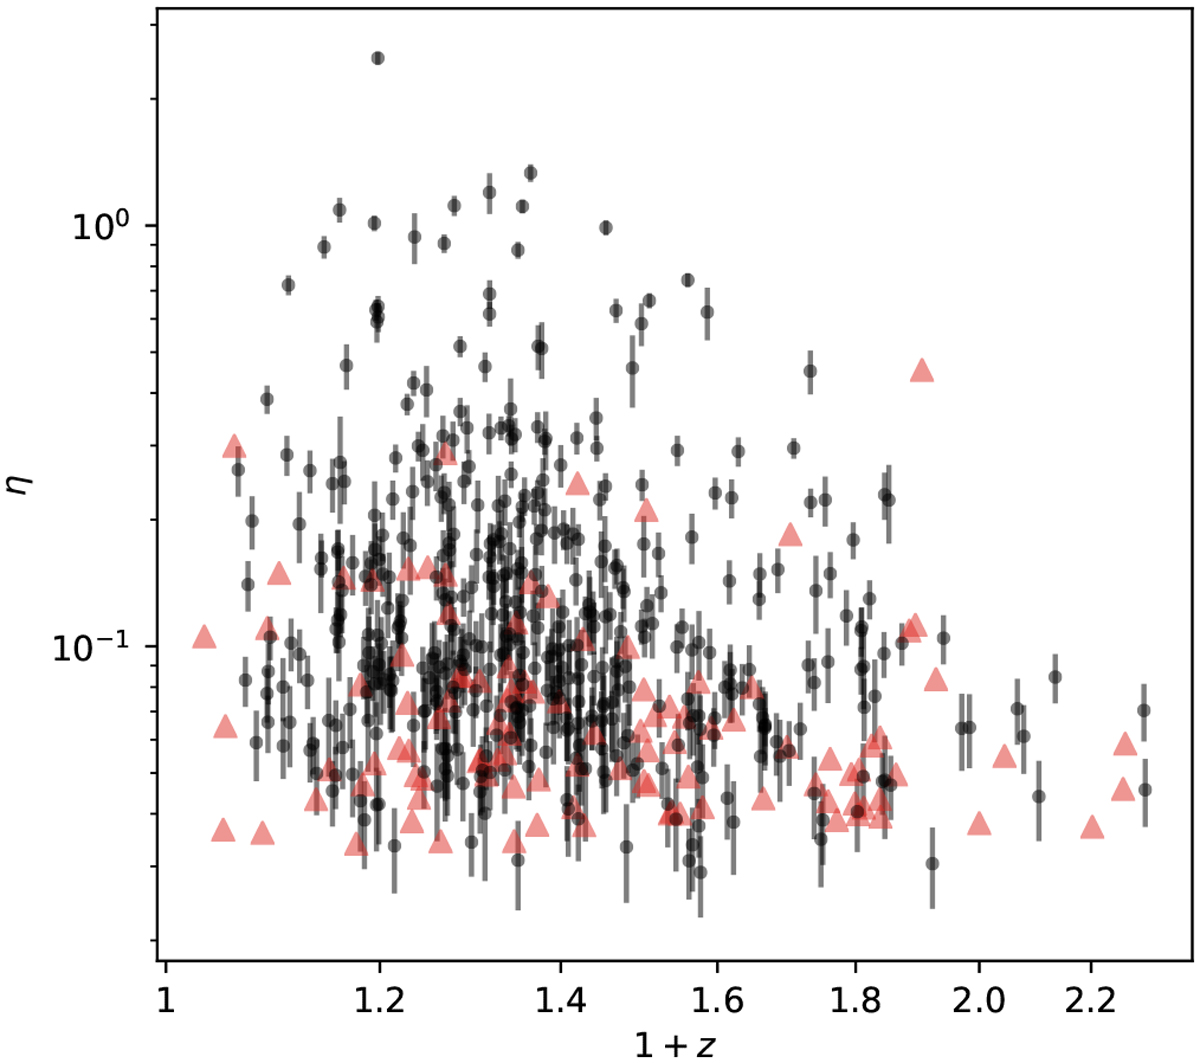
Observed count rate η (in the unit of counts per second) and the redshift z of the 542 eFEDS clusters. The 434 secure clusters with fcont < 0.2 (see Sect. 2.3) are shown as the circles, while the rest are marked by red triangles.
Current usage metrics show cumulative count of Article Views (full-text article views including HTML views, PDF and ePub downloads, according to the available data) and Abstracts Views on Vision4Press platform.
Data correspond to usage on the plateform after 2015. The current usage metrics is available 48-96 hours after online publication and is updated daily on week days.
Initial download of the metrics may take a while.