Fig. 14
Download original image
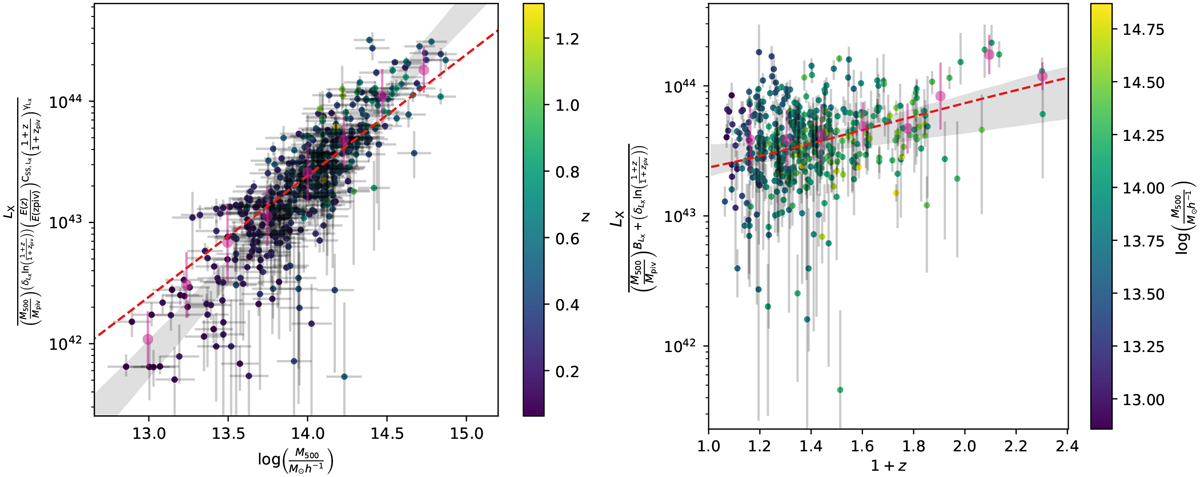
Observed soft-band luminosity Lx as a function of the cluster mass M500 (left panel) and redshift z (right panel). When showing the mass (redshift) trend in the left (right) panel, we re-normalize the observed quantity to the pivotal redshift zPiv = 0.35 (mass Mpiv = 1.4 × 10¹⁴h−1M⊙) as done in a similar manner in order to produce Fig. 10. The best-fit model and observed clusters are shown in the same way as in Fig. 10. The pink circles indicate the weighted mean of the eFEDS sample.
Current usage metrics show cumulative count of Article Views (full-text article views including HTML views, PDF and ePub downloads, according to the available data) and Abstracts Views on Vision4Press platform.
Data correspond to usage on the plateform after 2015. The current usage metrics is available 48-96 hours after online publication and is updated daily on week days.
Initial download of the metrics may take a while.