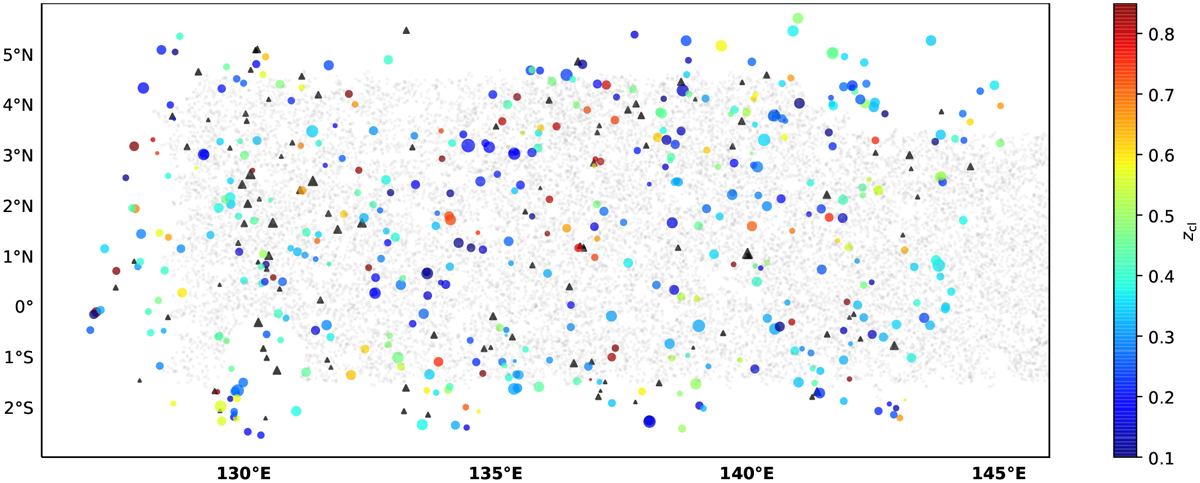
Fig. 1
Download original image
Angular distributions of eFEDS clusters and the available weak-lensing data set from the HSC survey. Out of 542 eFEDS clusters, there are 434 clusters as a secure sample, i.e., fcont < 0.2 (see Sect. 2.3). These clusters are represented by the circles, color-coded by their observed redshifts Zcl, with sizes proportional to their observed count rate η. The other clusters with fcont ≥ 0.2 are represented by the triangles. The underlying gray points represent a subset of sources that are randomly drawn from the HSC three-year (S19A; see Sect. 2.2) weak-lensing catalog.
Current usage metrics show cumulative count of Article Views (full-text article views including HTML views, PDF and ePub downloads, according to the available data) and Abstracts Views on Vision4Press platform.
Data correspond to usage on the plateform after 2015. The current usage metrics is available 48-96 hours after online publication and is updated daily on week days.
Initial download of the metrics may take a while.