Fig. 7
Download original image
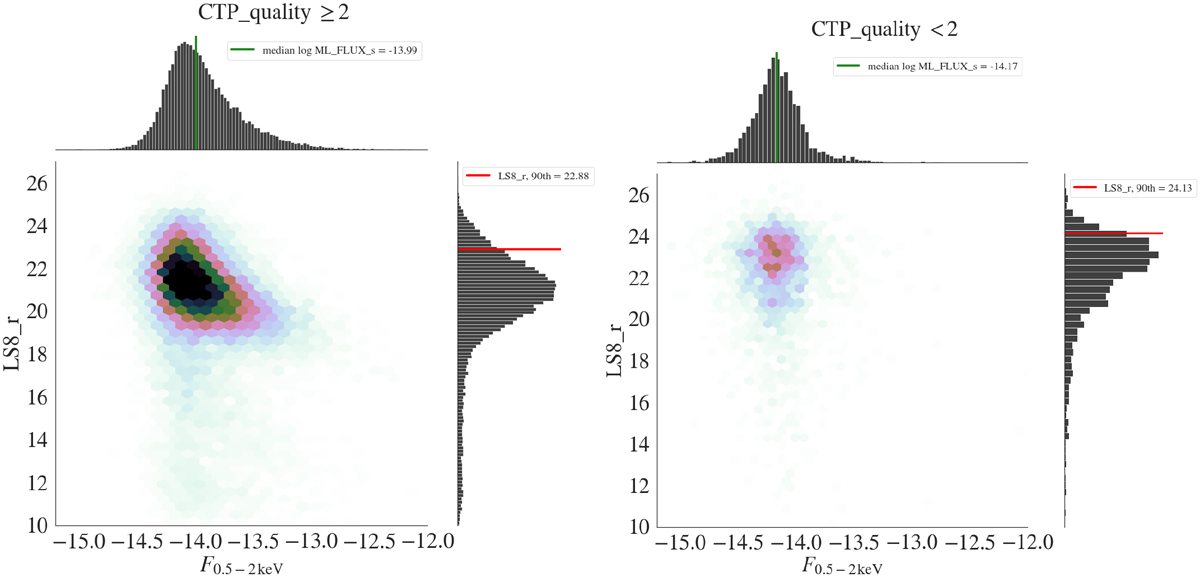
Magnitude distribution of the counterpart vs. the X-ray flux for sources with CTP_quality> = 2 (left) and CTP_quality< 2 (right). A cut at log ML_FLUX_s > −20 has been applied. The magnitude distribution is clearly different. The green lines represent the median 0.5–2 keV flux (−13.99 and −14.17), while the red lines mark the 90th percentile of the r-band magnitude distribution (22.88 and 24.13).
Current usage metrics show cumulative count of Article Views (full-text article views including HTML views, PDF and ePub downloads, according to the available data) and Abstracts Views on Vision4Press platform.
Data correspond to usage on the plateform after 2015. The current usage metrics is available 48-96 hours after online publication and is updated daily on week days.
Initial download of the metrics may take a while.