Fig. 6
Download original image
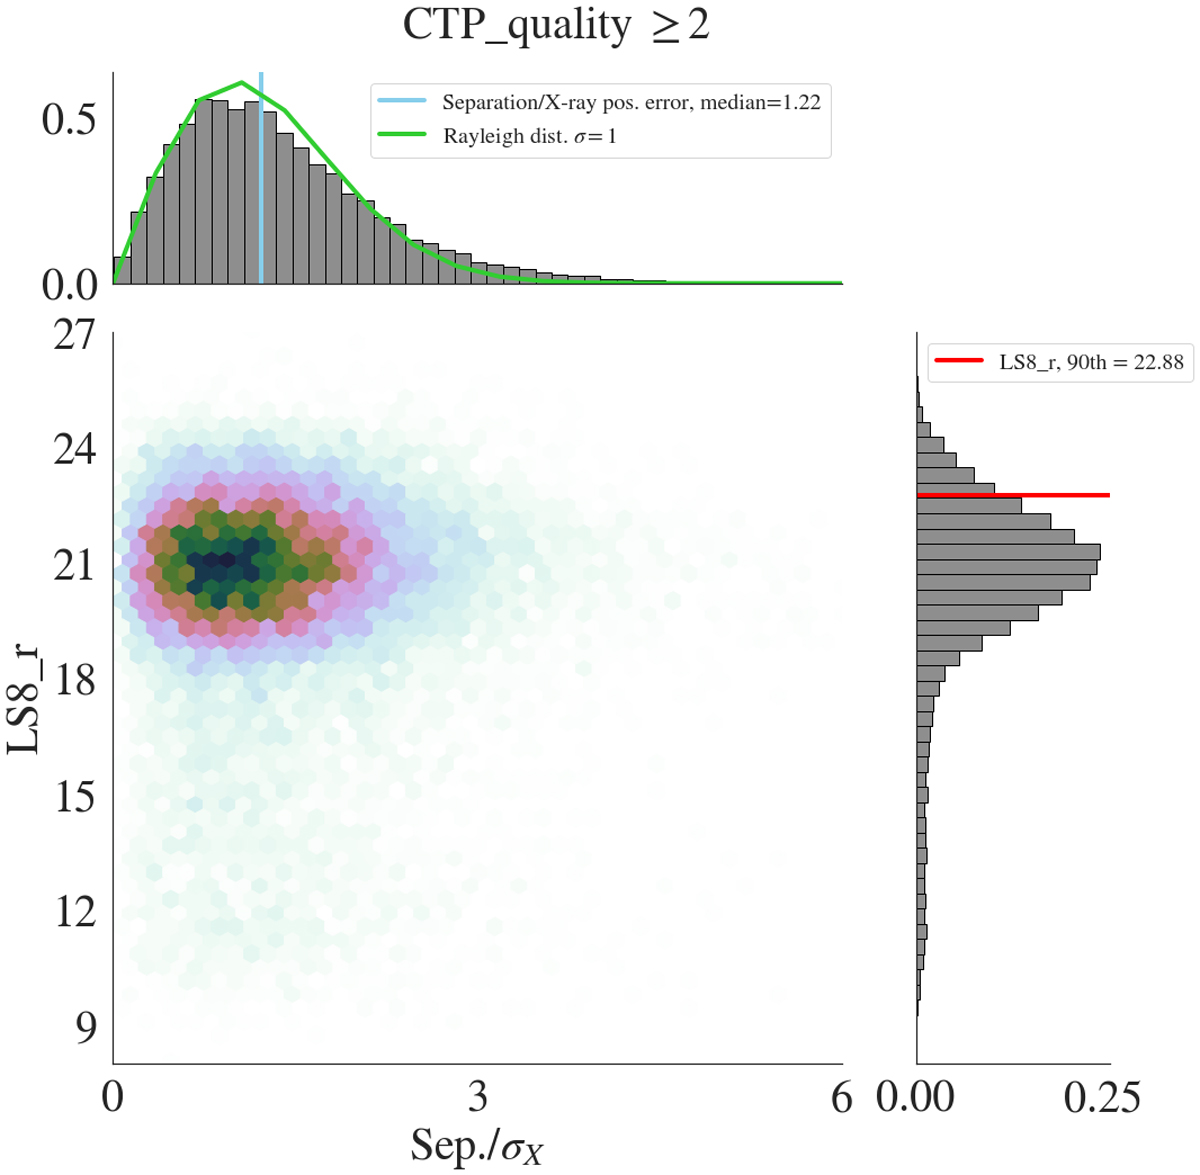
Separation between X-ray position and the selected counterpart normalised by the one-dimensional positional error of the X-ray source as a function of its r-band magnitude for the sources with secure counterparts (CTP_quality ≥ 2). The hexagons are colour-coded linearly according to the counts in the specific bins. The marginal histograms have a linear y-axis. The 90th percentile of the r-band magnitude distribution (22.88) and the median of the normalised X-OIR separation (1.22) are also reported in the marginal histograms. The 1σ Rayleigh distribution expected for the normalised separations is overplotted in green.
Current usage metrics show cumulative count of Article Views (full-text article views including HTML views, PDF and ePub downloads, according to the available data) and Abstracts Views on Vision4Press platform.
Data correspond to usage on the plateform after 2015. The current usage metrics is available 48-96 hours after online publication and is updated daily on week days.
Initial download of the metrics may take a while.